Doing some research
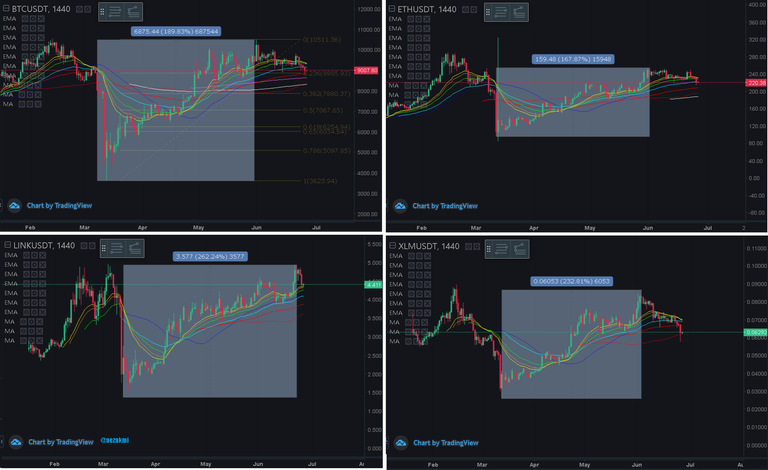
While looking for some potential gems in the Binance Futures markets, I found out that most of the coins have gained 100-250% from the local low (March) to the local high (June). Bitcoin gained 190%, ETH 180%, LINK and Stellar +200% - just to name a few.
Below is a comparison chart:
Ctrl + Click here to enlarge the image in a new tab (steemitimages)
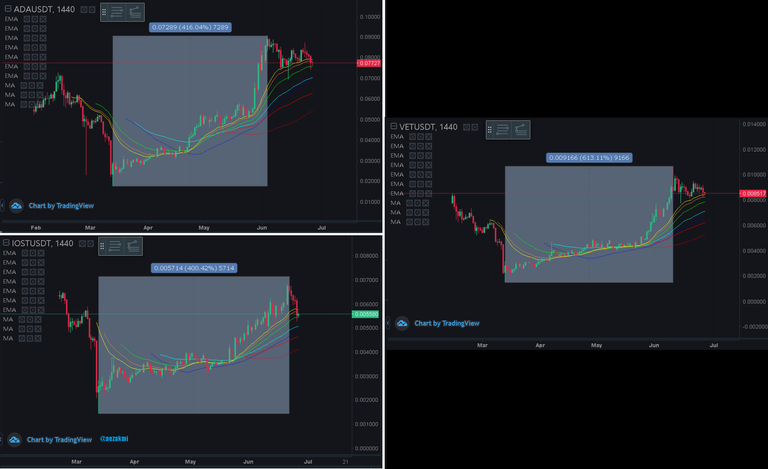
Exceptions
Of course, I also found out that there are some major exceptions, like Cardano (ADA), IOST or VeChain (VET), which surged 400-600%.
Ctrl + Click here to enlarge the image in a new tab (steemitimages)
Gems
I kept looking and researching, until I stumbled upon two outstanding gainers: Zilliqa (ZIL) and THETA, both with >1000% gains. Both of them are newly added to Futures Trading and are smaller cap coins, ranked 44 & 47 on Coinmarketcap. Trading such coins is indeed risky, but the profit could be enormous.
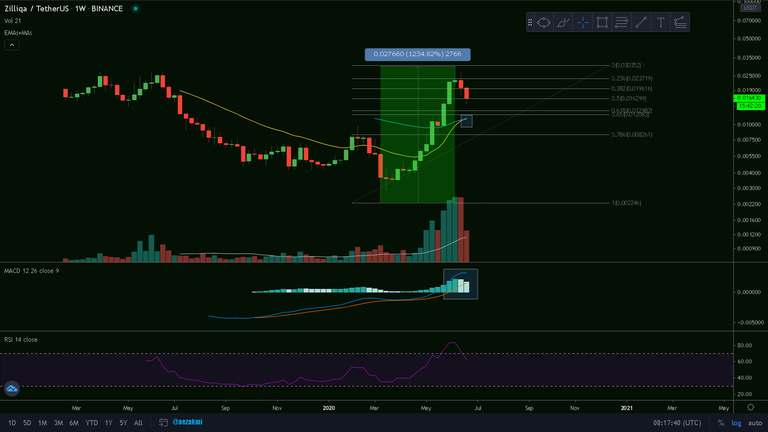
ZIL/USD Weekly Chart
1234% in three months - not bad at all. We're currently finding support at the 0.5 Fibonacci retracement, but the trading volume has drastically decreased and the MACD Histogram is shrinking, indicating that the bulls are losing momentum. However, the RSI is entering the neutral zone and we have a 21 - 55 EMA cross (yellow, blue) which is kind of a very bullish sign, considering that most of the other coins are still far away from this.
If the market stays neutral-bullish, it is possible for us to get another leg up in the following months, reaching the previous top (or even higher, who knows) and get a RSI and MACD bearish divergence. At the other hand, if things get ugly, we could revisit the 0.618 retracement and the 21&55 EMA - which will probably grant a very strong support level.
Ctrl + Click here to enlarge the image in a new tab (steemitimages)
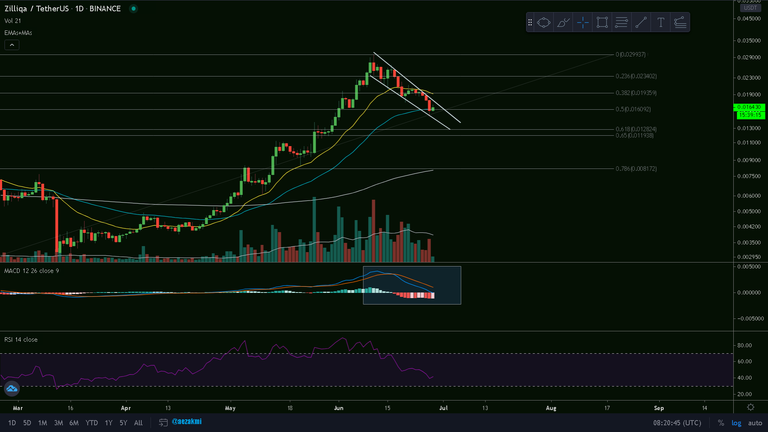
ZIL/USD Daily Chart
On the daily we're following an aggressive falling wedge pattern, with decreasing trading volume, and are finding support at the 55 day EMA (blue) and 0.5 Fib. retracement. The flat MACD-Histogram and decreasing Volume could be early signs of the bears losing momentum, so thing are about to move.
If things get ugly and we're getting near the 200 day MA (grey) and the 0.786 Fibonacci retracement, I'll be looking to accumulate more
Ctrl + Click here to enlarge the image in a new tab (steemitimages)


Thanks for reading and safe trading!✌
If you find this post useful, please:
