Introduction: Basic Trend Trading
Who needs another article on basic trend trading? Well. A friend asked if I could help him with some cryptocurrency trading.
We had a phone conversation and the big message was "keep it simple". It was clear my friend did not have much idea about trading, about charting and about cryptocurrency. This sounds like a disaster waiting to happen - and so many times it is. Over the years, I have seen a lot of get rich quick schemes especially forex trading and more recently crypto trading. Mostly they all skip basic trend trading as a topic.
So I agreed to make a video about trend trading starting with the basics. The message was "keep it simple". So here we go with basic trend trading
I set it out in the video with 3 broad topic areas - I will write about each below the video
Basic Trend Trading: How to Draw a Trend Line
Let's start with a definition of a trend
- Uptrend - price making higher highs and higher lows (HH and HL)
- Downtrend - price making lower highs and lower lows (LH and LL)
Now a higher high is where the top of the current bar or candle is higher than the previous high. A lower low is where the bottom of the current bar or candle is lower than the previous low. You can fill in the other variations (LH and HL)
To draw a trend line, we start with a chart in the timeframe we want to work on => best done on a weekly or a daily chart to smooth out some of the noise. Look at the chart and find the turning points where price changes direction. Join up as many touches (tips of the bars/candles or closes - you choose). It sometimes helps to use a line chart (= joins together the closes for each bar/candle). The yardstick to look for is at least 3 touches - 2 could be a bounce only. Quite often what I do is draw the trend on the weekly chart and then come down to refine it on a daily. The end price of a week is quite important as forex markets are closed on weekends and big traders often close out open positions = so we really know how they were feeling on Friday.
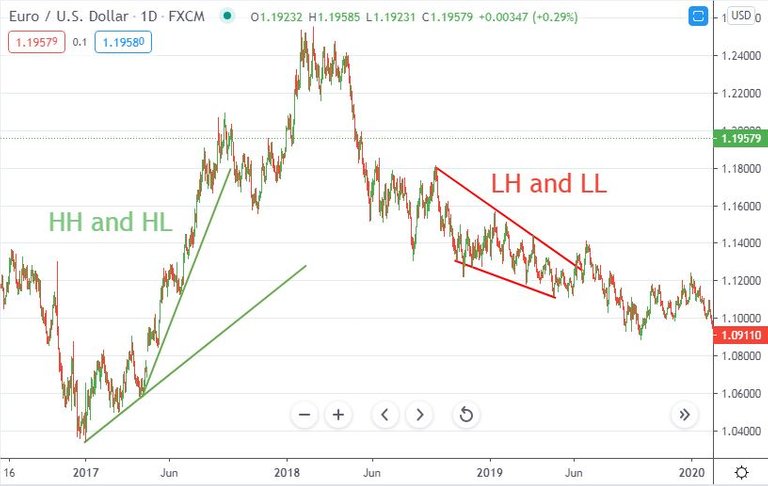
The chart shows two trends on a recent EURUSD chart (which is what I showed live in the video)
Basic Trend Trading: The Principles
Trend trading is the most profitable type of trading because it often captures larger moves in price than range trading. The challenge is that markets trend only about 30% of the time. There are lots of things to trade and it is just a question of finding something else that is trending. OR doing nothing which is often the best trade.
The science of trend trading is to identify when a trend is confirmed and then to find a suitable turning point (called a reversal) to enter the trade. Now science tells me that one only knows when a trend is confirmed at the start of the 3rd cycle up or down. So that is where basic trend trading should start - at the start of the 3rd cycle. Of course we can study price action and make entries at the start of the 2nd cycle up or down if we are confident that price is not going to take out the reversal we are relying on (i.e., it is going to keep going lower for down trend or higher for up trend). Price action is another video topic.
Basic Trend Trading: A Process
It is best to run a disciplined process for scanning for trade ideas. This is a process I was taught.
- Confirm the trend direction using moving averages: Stack 3 moving averages on top of each other (I use 9 day, 20 day and 50 day exponential moving averages). All 3 averages must be layered the right order for a trend to be clear. [Uptrend 9 above 20 above 50. Downtrend: 9 below 20 below 50]. It does not matter what periods you use - just space them out a bit to reduce noise.
- Look for prior day in direction of the trend. In the video I talked about the armies of buyers and sellers. If one uses colours for bars or candles, each bar tells one what the dominant mood of the prior bar was - green for buyers and red for sellers. So for uptrending charts, we are looking for green bar for prior period and red bar for downtrend. If there is a mismatch, skip to the next pair to study = more sellers on a day in an uptrend suggest the mood was selling and not buying.
- Wait for a reversal on the chart or on a lower timeframe (e.g., on 4 hour chart for a daily view). Next step is to work through all the candidate pairs and identify if there is the prospect of a reversal in the direction of the trend (or confirmation of a reversal). This gives us a short list of trade possibles.
- Check there are no resistance levels in the way. Now we want to find if there are reasons not to take the trade. The most important way is to find out where the armies of buyers and sellers were lined up in the past. Those armies are lurking above and below each of the previous reversals (changes in direction) on the chart. Draw the horizontal lines in - I use green for weekly and red for daily. The armies sometimes line up above and below the parallel trend lines above and below the price action-like I showed in the video
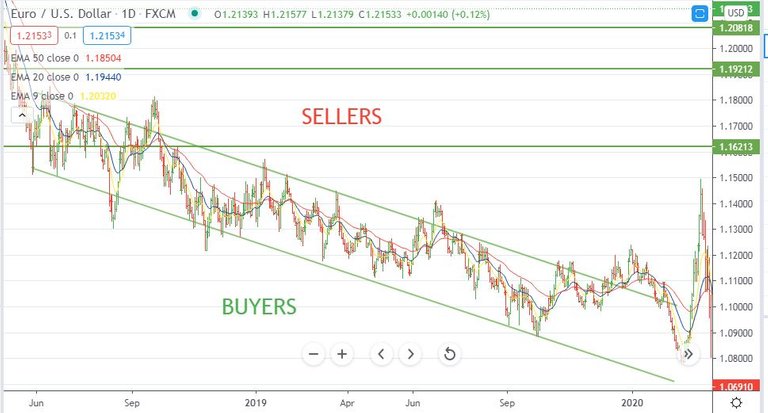
Do that on a weekly chart, and then a daily chart. If your trade has to move through one of those resistance lines to win, do not take the trade. Wait for the next pull back to see if there is space to win. - Check for news coming up: The other big reason to not take a trade is to check upcoming red or orange flag news for your currency pairs. I do that at the start of each day and simply screen out all currency pairs with big news coming - the most critical news events are central banker things and unemployment numbers and release of monthly PMI-type statistics.
- Make sure there is no divergence in momentum: The last area to explore for reasons to not take a trade are changes in momentum. This is a topic of a video of its own but I did touch briefly on it in the video. The momentum indicators will give you warning when a trend move is beginning to lose momentum and might end sooner or abruptly. The two I mention in the video are MACD and Stochastic.
Placing the Trade
This is a mechanical process best managed with a trade management tool. Let it do the work but these are the steps- Decide on entry point (based on previous bar) - say 2 pips above the previous bar high for a long trade or 2 pips below the previous bar low for a short trade
- Identify level for stop loss say 5 to 7 pips behind the last reversal or a strong horizontal level
- Calculate position size (based on your preferred risk %; the entry level; and the stop loss level). Normally one would only want to have 3 to 5% of your capital at risk at any one time. Position size of 1% is quite normal and I often trade at 0.5% if I have some reservations about the trade - I can scale in later if things move the right way.
- Enter the trade as a pending trade (buy stop for long trades and sell stop for short trades). Do not enter market trades - there will always be another set up coming along
- Edit trade expiry date/time (if needed). I do this for all pending trades to close a minute before the bar I am trading closes. You never know what the next bar might bring.
- Decide on exit approach - this is where art replaces science. The easiest way to exit is to set a take profit target at a risk reward ratio of at least 1 to 1. A visual way to do it is to see where price would cycle to if it reached the other side of the channel it is trading in or the previous reversal. Pick that point off the chart and use that. The last way is to set a trailing stop loss either automatically or manually. One of my coaches would do it manually every time there were two consecutive bars in the direction of the trade (i.e., two buyer bars for up trend or two seller bars for down trend). The best part of trailing stop losses is it lets the market decide the exit point which means trades might run longer than with set take profit levels.
Resources
Charting: Trading View is a relative newcomer to the charting world. It offers very competitive pricing for real time forex prices. Real time prices are essential if one is trading down the timeframes within a day. It also gives access to a huge range of instruments including all stock markets, interest rates, futures, cryptocurrency. As I trade all instruments globally this is a great resource for me.Of course, your forex broker is also giving you real time prices - so you can work on the charts delivered through the MT4 trading platform. I use both - Trading View for charting work and MT4 for trade entry and trade management. Try Trading View for free
Checking News: Forex Factory publishes a calendar of upcoming news events by currency. Just select the filter (top right hand corner - green funnel icon) for red and orange flags and check them off.
Forex Brokers: Forex trading carries risk. Choose a forex broker that is regulated in the country in which you live or in one of the major economic blocs (USA or European Union). If you want a referral for the brokers I use (in Australia and Europe), send me an email at [email protected]
Investing Posts: Until teh Covid19 event hit I was writing regular posts on all my investing activity. Find them under teh Investing Blogs tab. I did write up a post on Income Strategies Using Options a few weeks ago
Disclaimer
Trading any financial market involves risk. This blog post and video and all and any of its contents are neither a solicitation nor an offer to Buy/Sell any financial market. The contents of this material are for general information and educational purposes only. Consult a financial adviser if you are uncertain about anything.
Posted from my blog with SteemPress : https://markcarrington.com/basic-trend-trading/