
Direct from the desk of Dane Williams,
exclusive to leofinance.io
Key Takeaways:
- Bitcoin has dropped through daily support.
- While still in an overall bullish trend, this could change in an instant from here.
- Our bias shifts to only looking to trade Bitcoin from the short side.
Bitcoin Technical Analysis
Okay, now things are about to get real.
I've talked about my market philosophy on the blog quite a bit, sharing my opinion that price action in between daily support/resistance zones is largely nothing more than noise.
In a strong bullish trend like that which Bitcoin has been in for the last 6 months or so, any pullbacks after strong breakouts really don't matter.
But for the first time in a long time, Bitcoin is now dropping through a daily support zone.
Take a look at the daily chart below.
BTC/USD Daily:
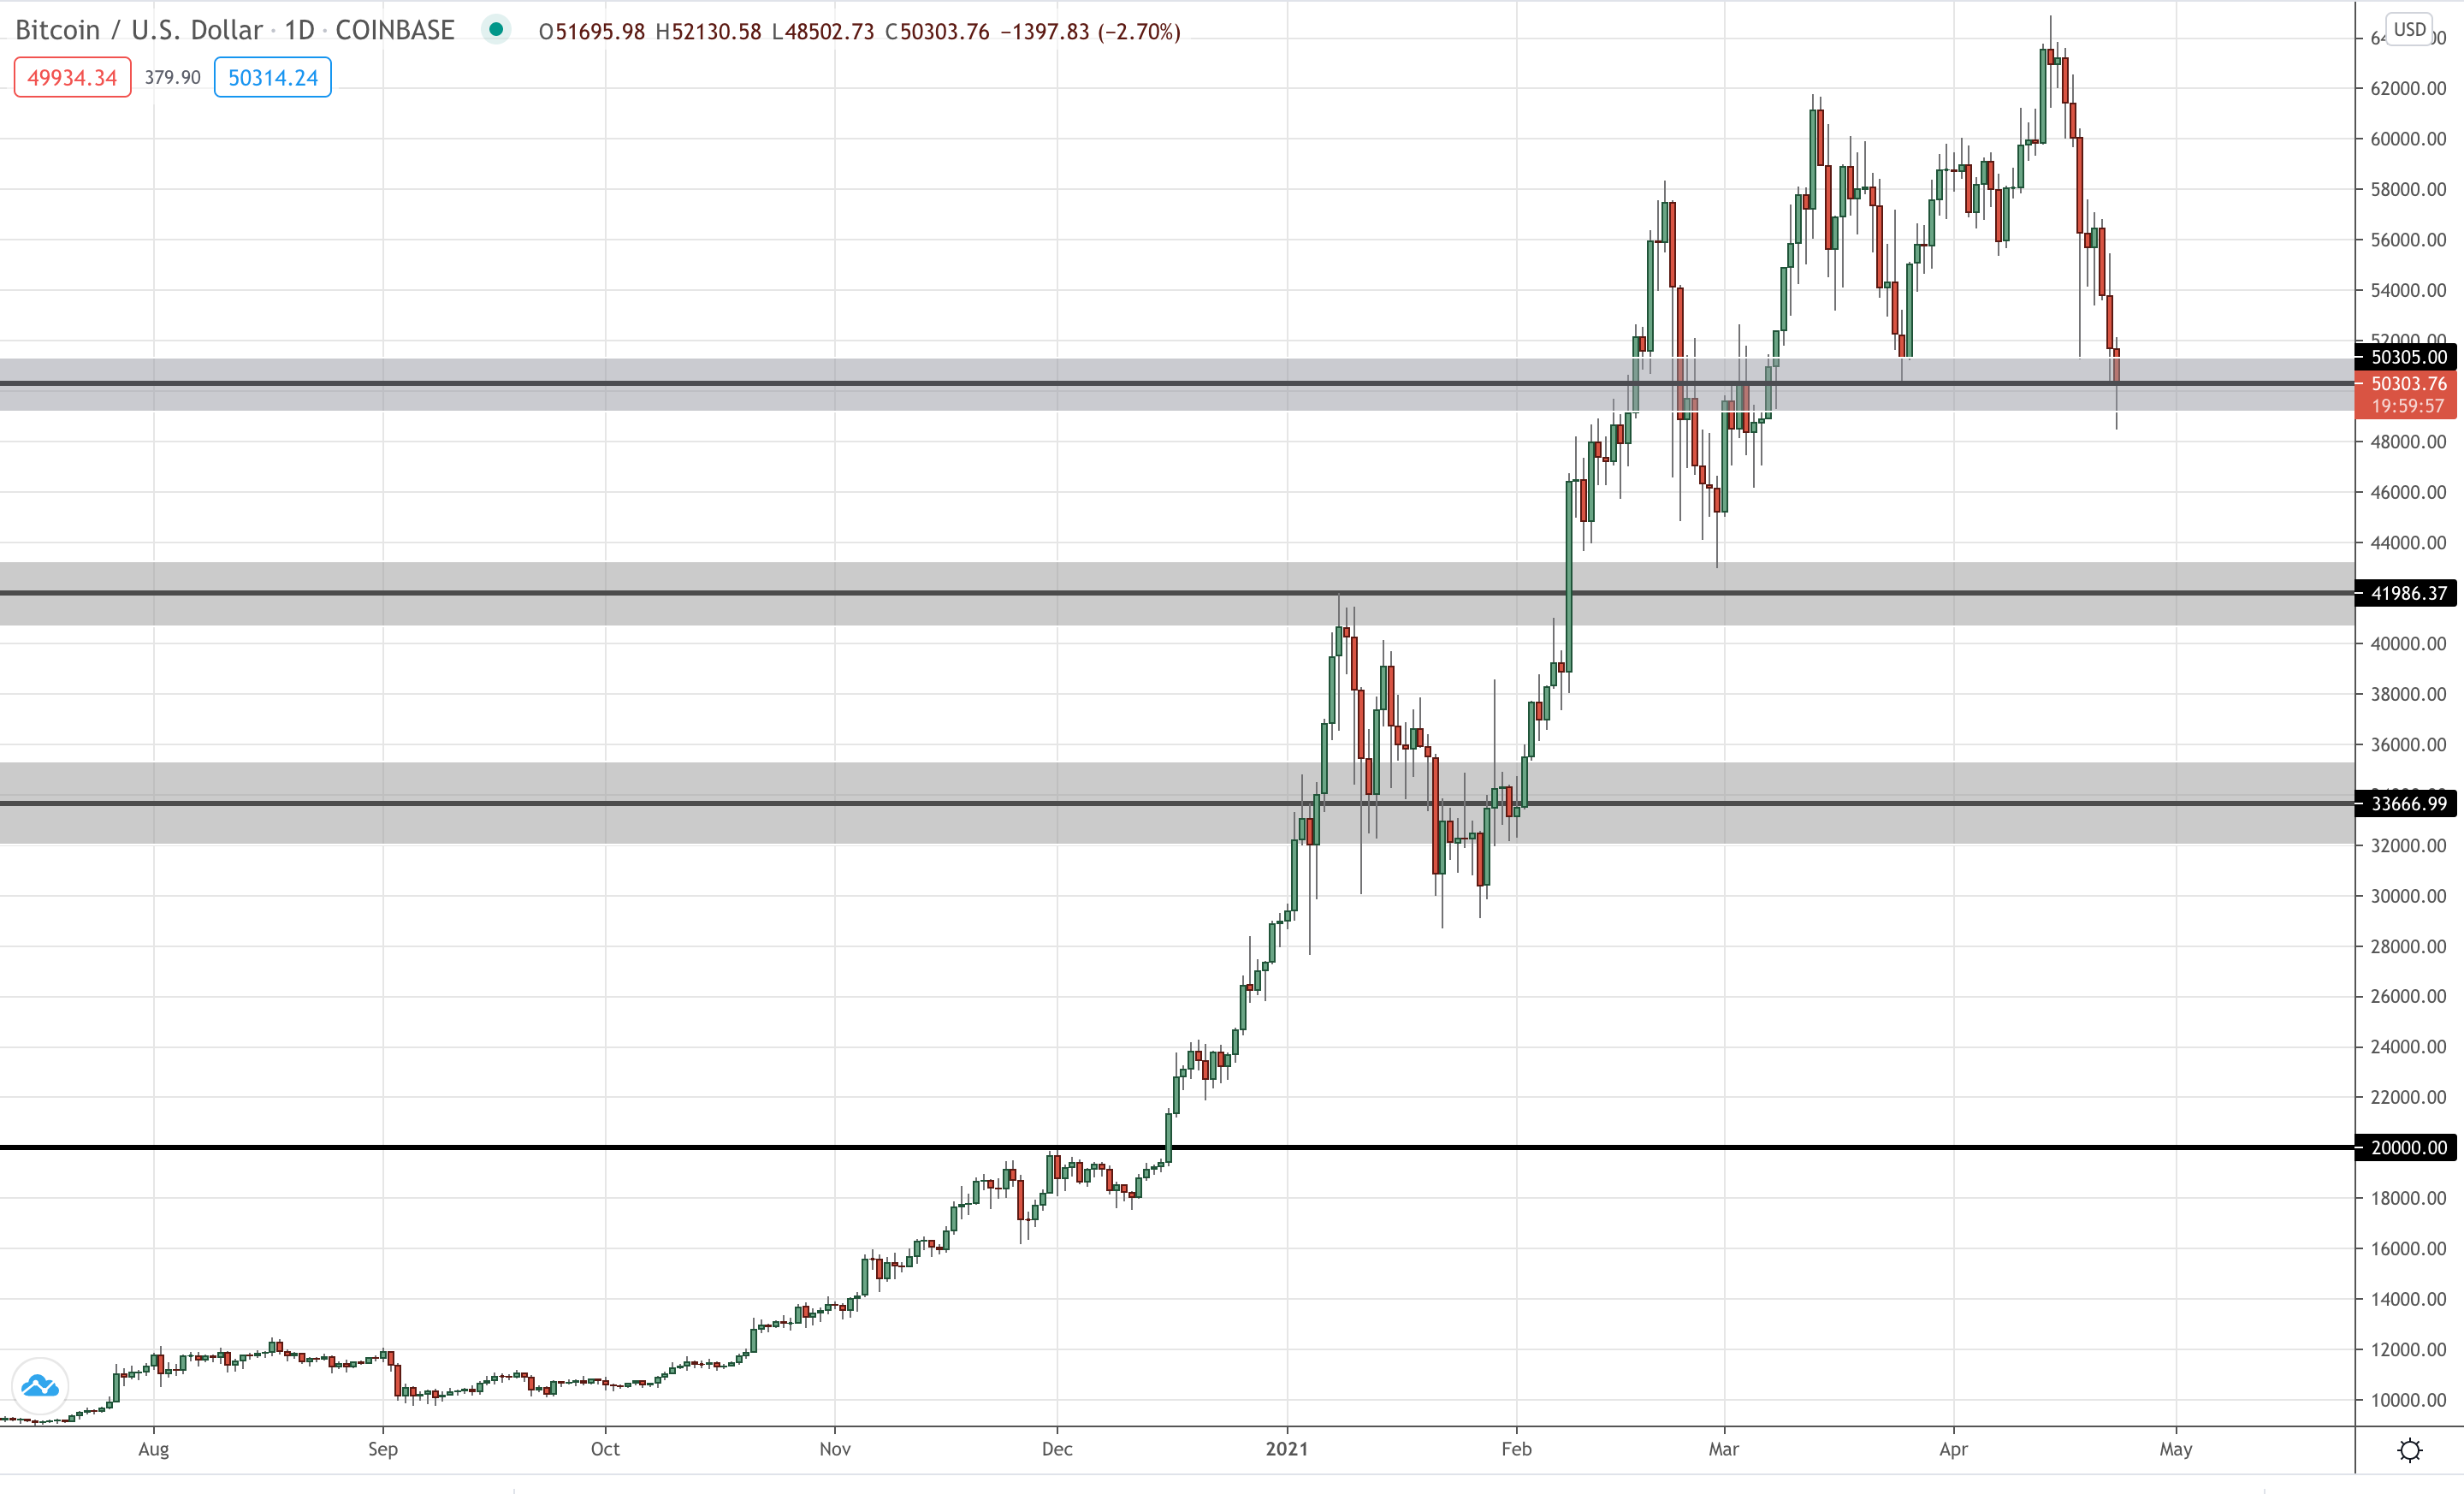
I'm literally watching the bears take control as they drive price down through our daily support zone.
With this break, our day trading bias shifts to only wanting to trade Bitcoin from the short side.
In order to look for an entry, let's now zoom into an intraday chart and take a look at the price action as price drops through daily support.
BTC/USD Hourly:
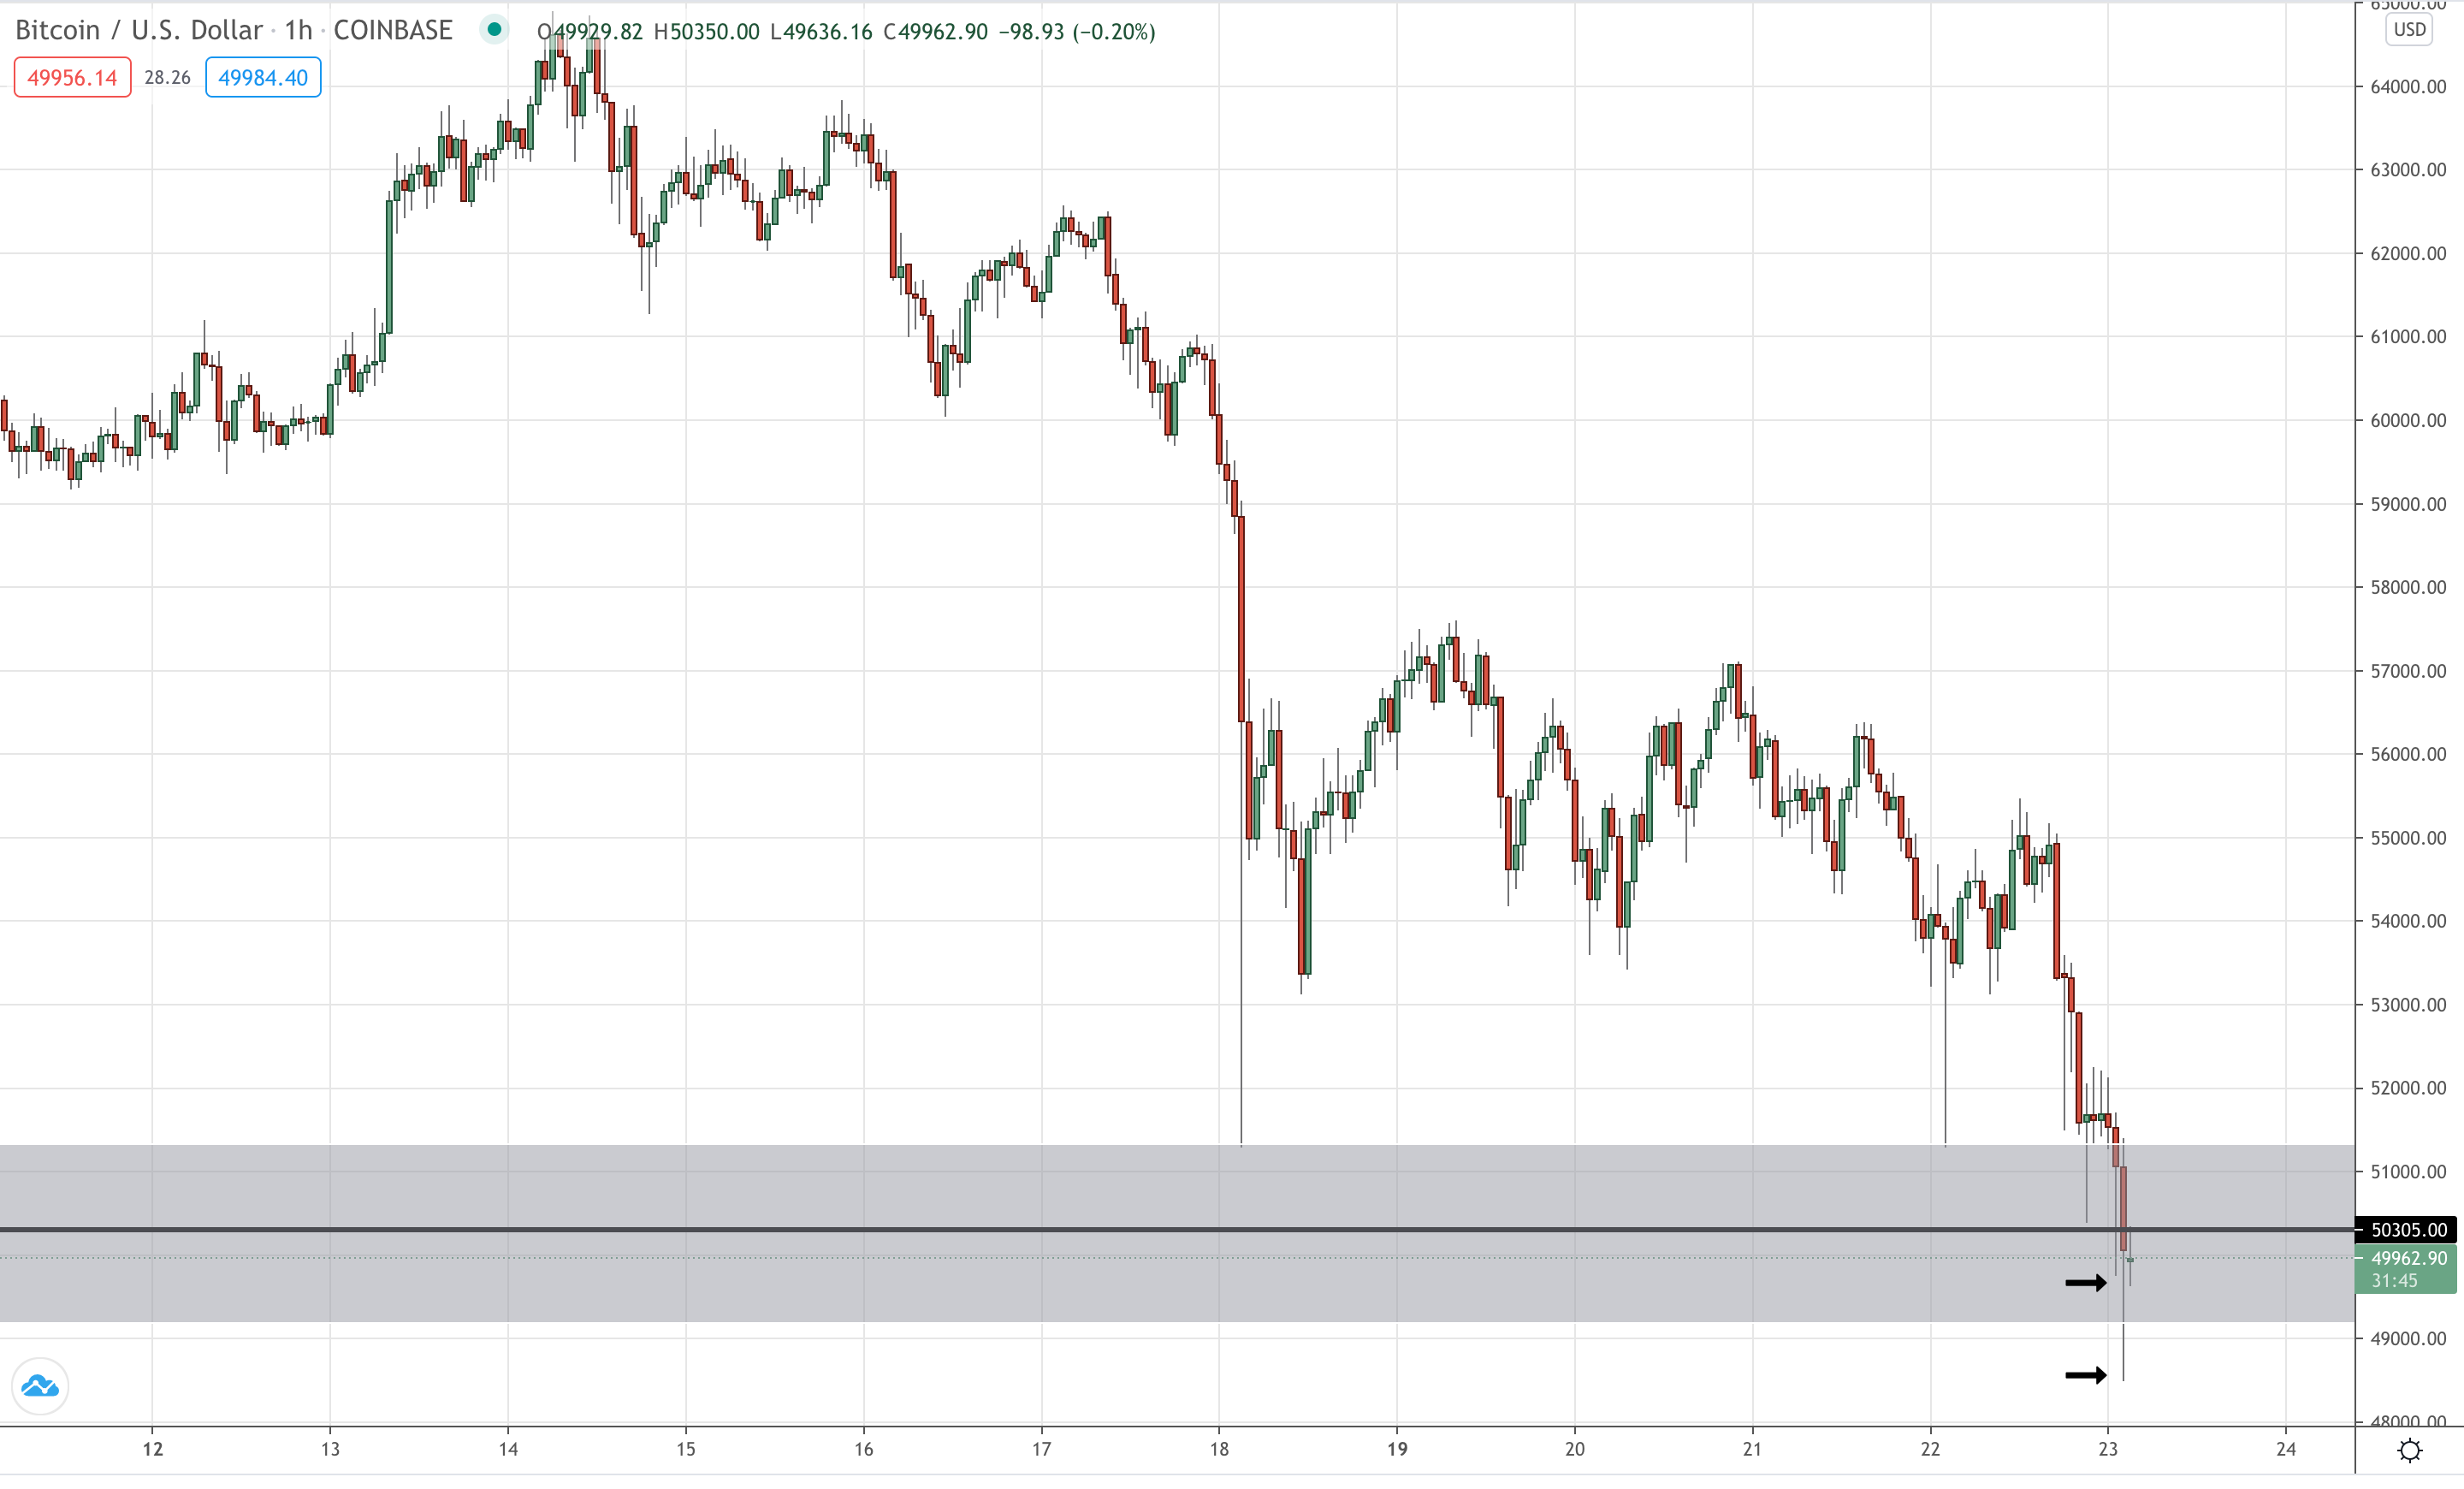
On the Bitcoin hourly you can see that there doesn't look to really be anyone willing to catch the falling knife here.
At least nobody with deep enough pockets to stop the march of the bears and we're likely to go through the zone without much trouble.
With that in mind, this might be a nice opportunity to ride on the bear's coattails and take advantage of this momentum drop.
There's no doubt that the path of least resistance right now is down and that's the direction we want to be trading, at least in the short term.
Why fight against the tide if we don't have to, right?
So how should you attack this daily support break?
The exact same way that we always do, of course.
Wait for a short term support zone (hourly green candle), to be retested as resistance and use that as an entry signal.
This allows us to keep our stops tight and target 1:3 risk:reward on the trade on the initial momentum move.
Best of probabilities to you.
Data to Watch:
- Not applicable on decentralised cryptocurrency markets.
Why not leave a comment and share a chart of your own in the comments section below? All comments that add something to the discussion will be upvoted.
This daily market analysis blog is exclusive to leofinance.io.
Posted Using LeoFinance Beta
I saw your comment after on the updated graph. From your daily chart, I would of expected the next level of support to be at 40k since it is a psychological level. Is there any specific reason that you choose 42k?
Posted Using LeoFinance Beta
While there's no definitively correct way to draw support/resistance, I see levels where price has sharply reversed from, as being much more significant than a psychological level in isolation.
The 42K zone I have on my chart is there because of the previous rejection that the arrow points to on the chart below.
BTC/USD Daily:
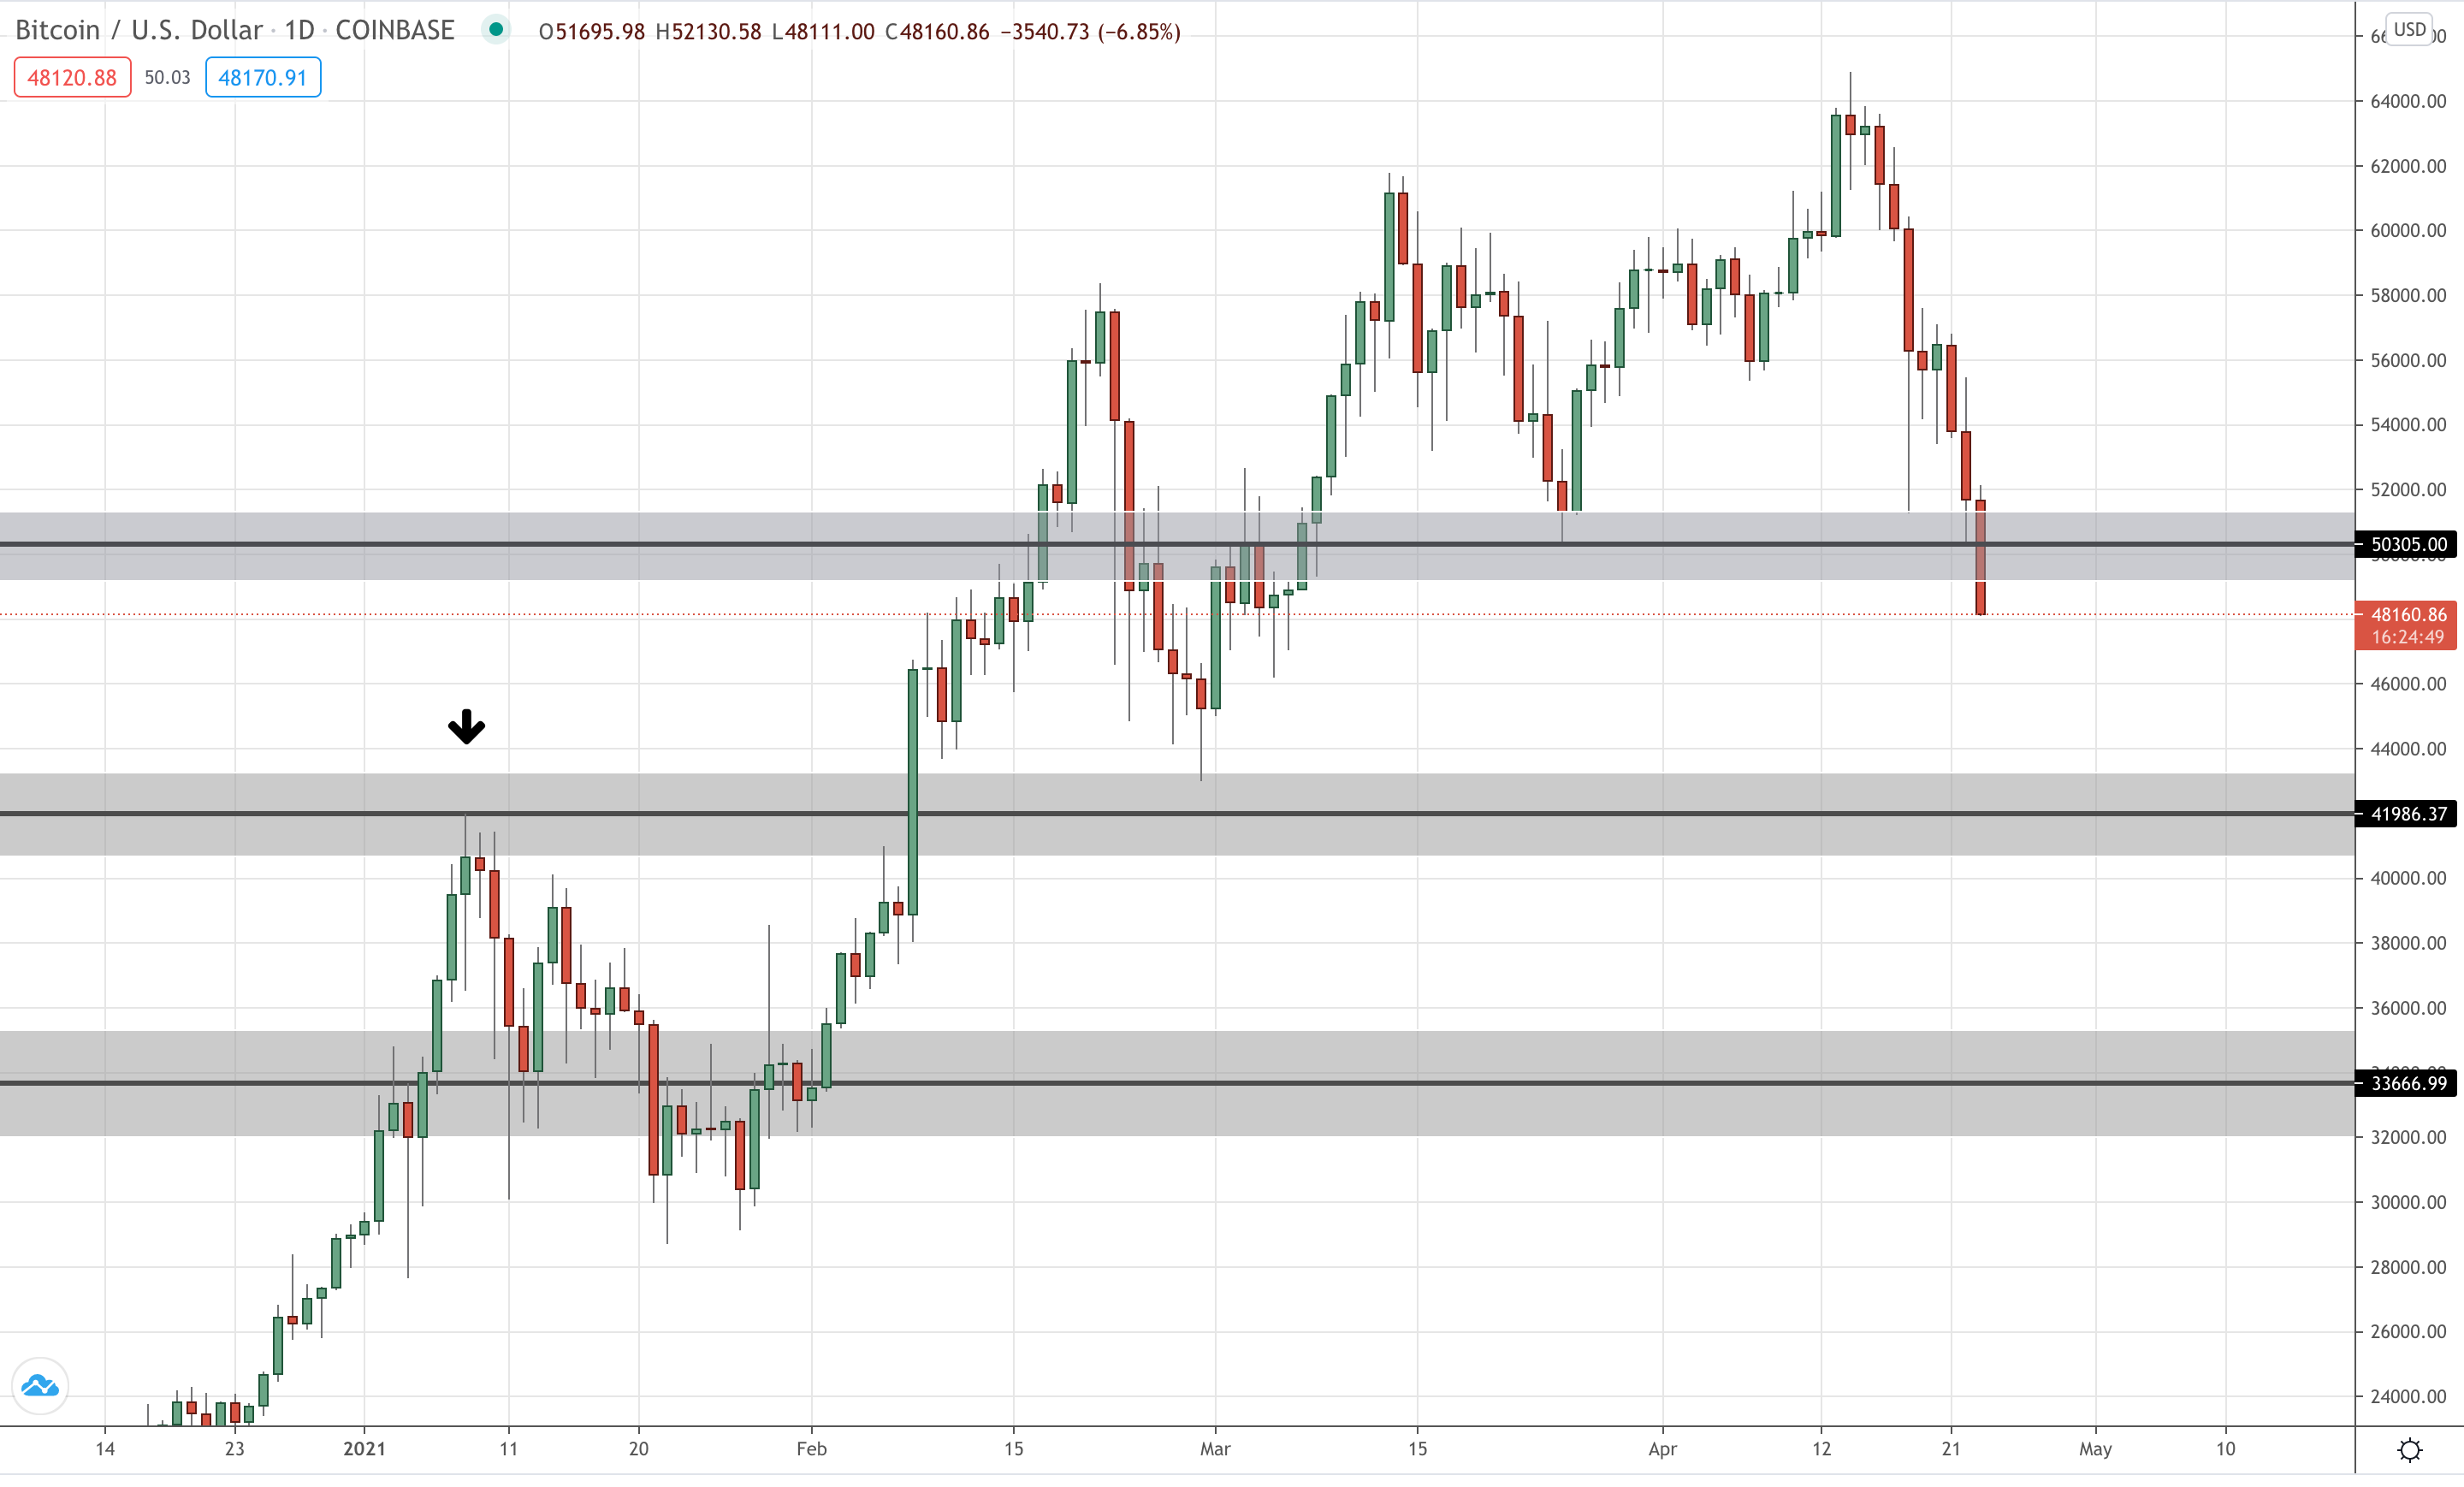
In my opinion, the way that price rejected so hard from that particular level in the past, gives it much more significance than the psych level which hasn't seen a rejection of that magnitude.
Posted Using LeoFinance Beta
Thanks for the clarification. I generally tend to just use the psychological levels because its easier. I know about the relative tops and use them from time to time but I didn't think it was as important because the backtest just didn't dip down far enough.
Posted Using LeoFinance Beta
Good analysis my friend. I think we will see BTC break through that $50K support and reach $45 and $42K zones afterwards. Those points are really very important for a correction and for buyers.
Posted Using LeoFinance Beta
The trade didn't quite work out, but the price action that came from it is certainly good for the long term bullish prospects of Bitcoin :)
Posted Using LeoFinance Beta
Exactly, in this case the bulls managed to dominate. We must always be attentive to price action and chart patterns, supports and resistances linked to the above mentioned give us enough information to operate in the market.
Exacto, en este caso los toros lograron dominar. Siempre hay que estar atentos a la acción del precio y los patrones en las graficas, los soportes y resistencias ligados a lo antes mencionado nos dan la información suficiente para operar en el mercado.
Posted Using LeoFinance Beta
Price going through daily support as I'm hitting publish.
The setup is there...
BTC/USD Hourly Updated:
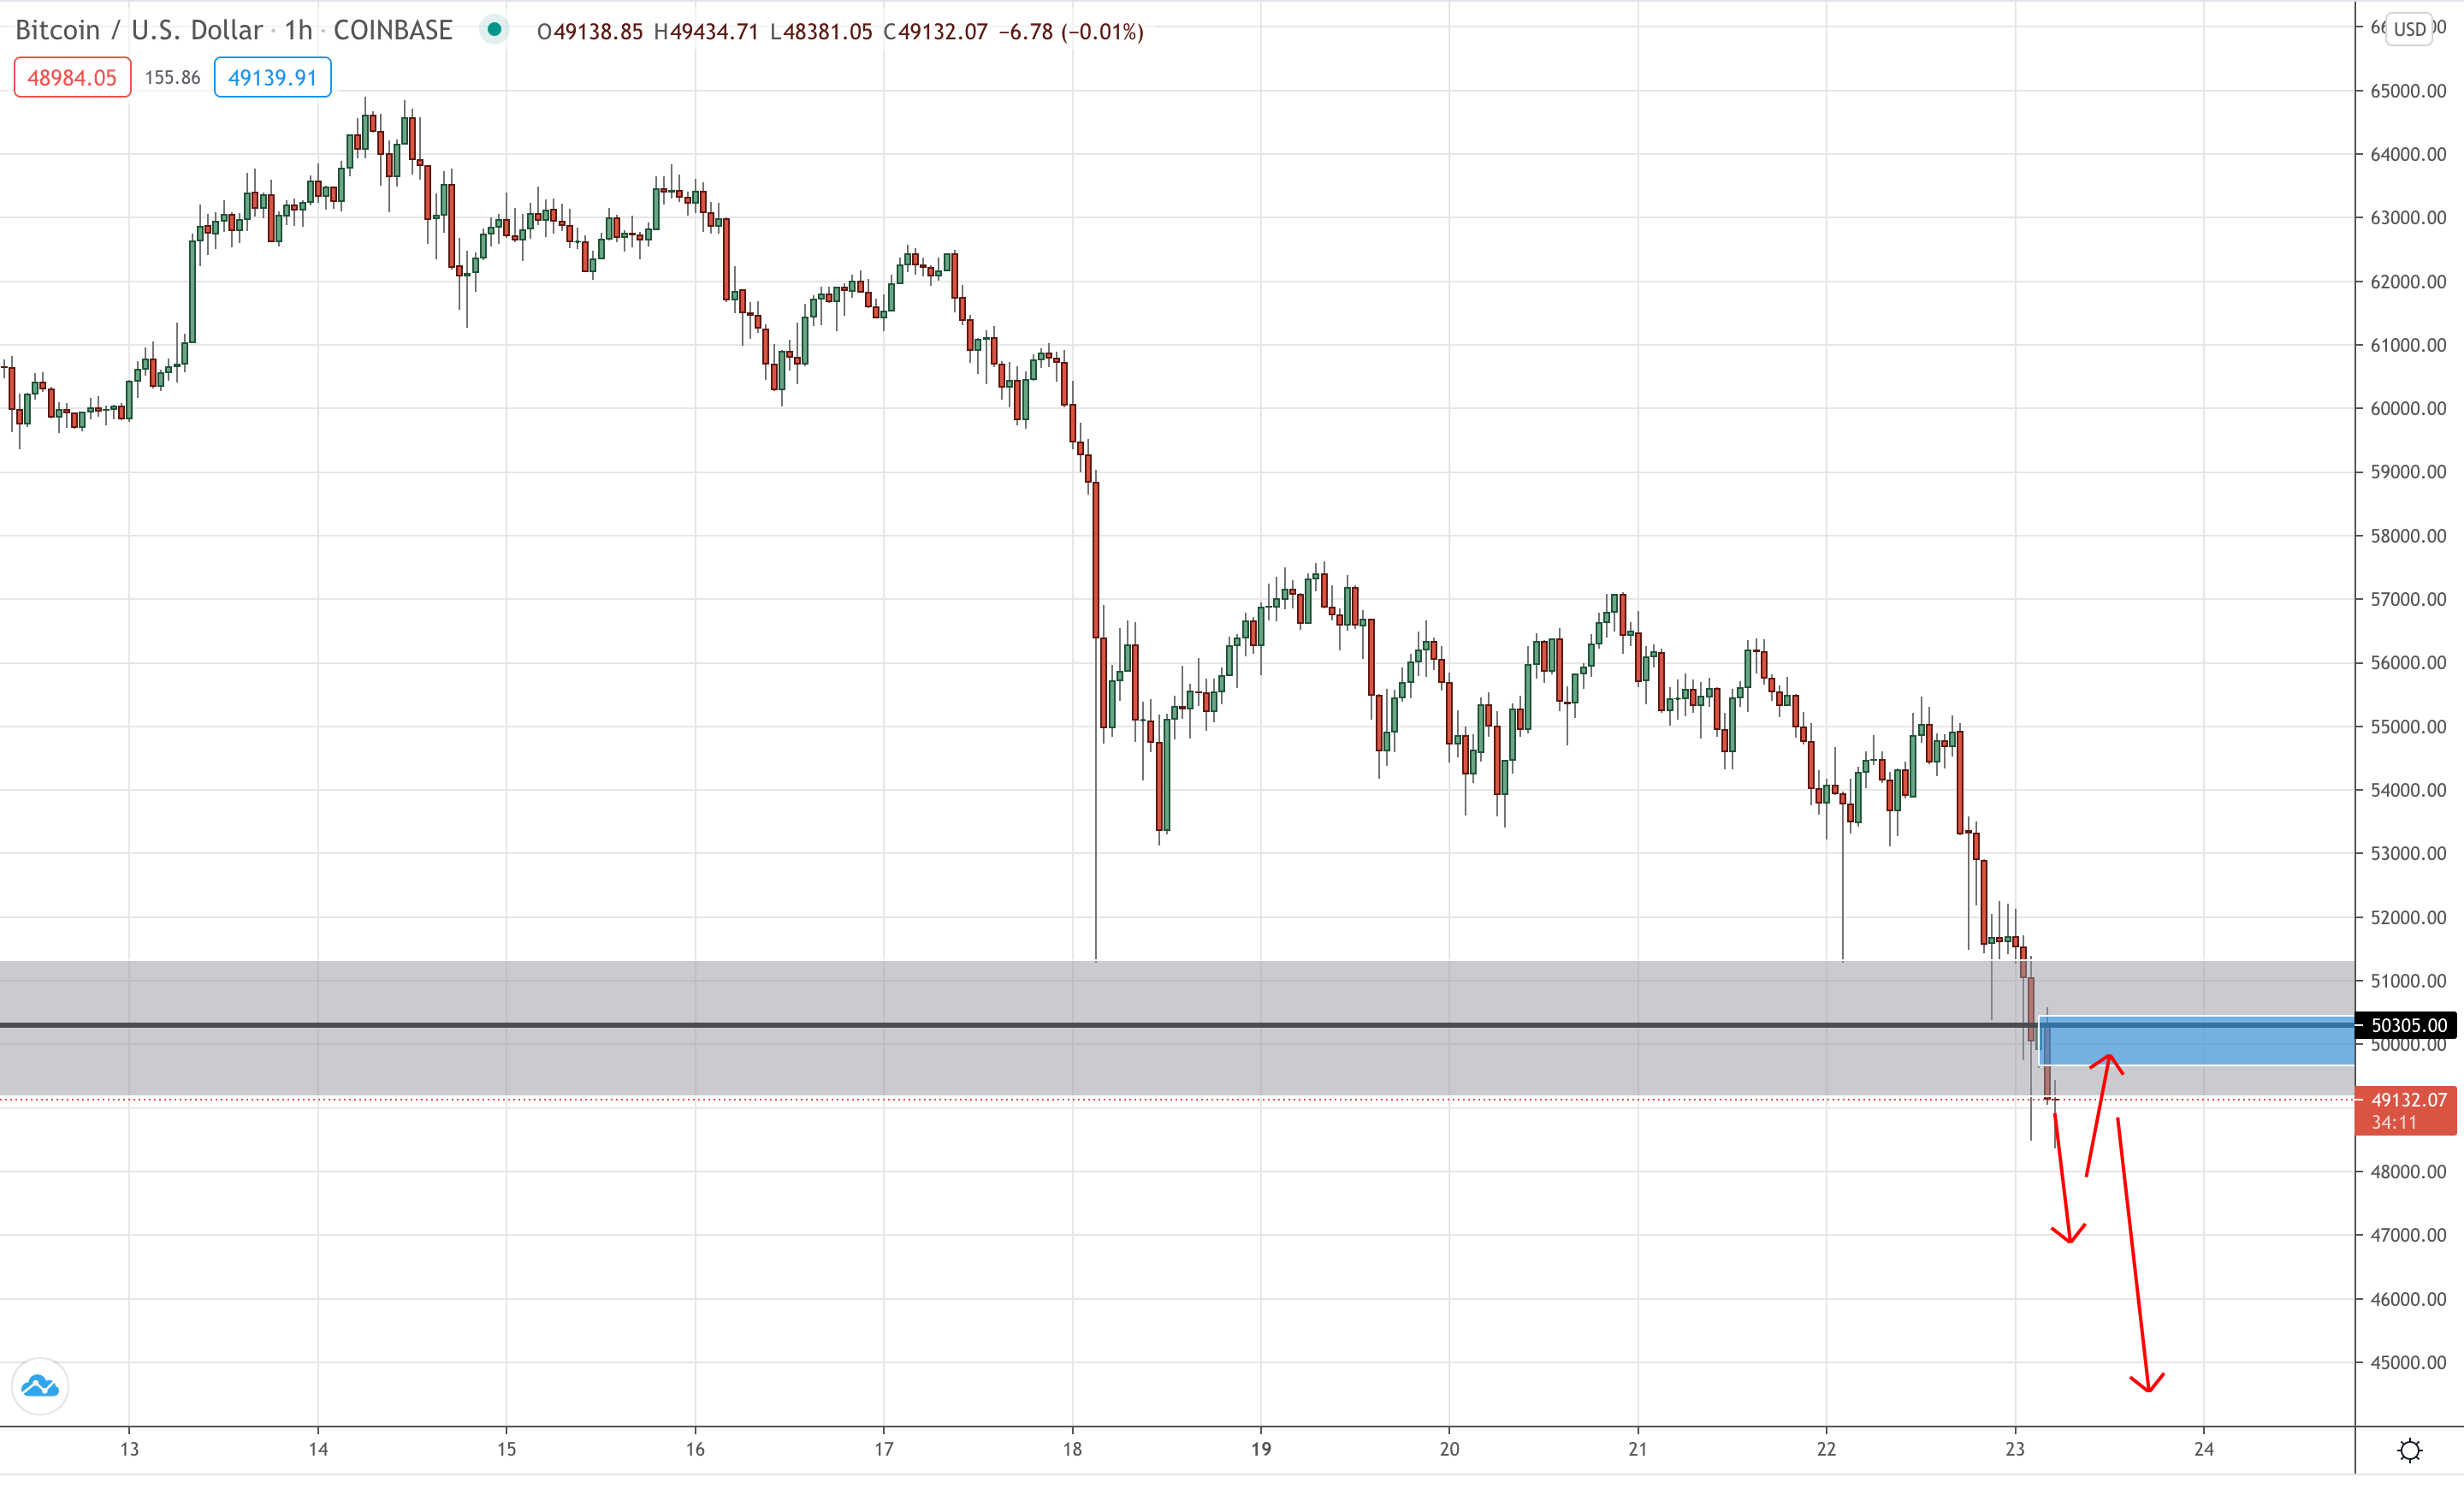
...Let's now see what price gives us.
Posted Using LeoFinance Beta