Happy Thursday. Tomorrow appears to be a massive day in the Bitcoin Options Market with approximately $1 Billion in Options set to expire.
Bitcoin Options Market Faces Record $1 Billion Expiry on Friday
According to the article, there are 114,700 options contracts valued around $1 Billion USD across Deribit, CME, Bakkt, OKEx, LedgerX which are set to expire, with open interest clustered around the $10,000.00 - $11,000.00 strike prices and recent open interest buildup around the $9,000.00 strike price.
Get Ready for a bumpy ride.
With that, let’s get to the TA...
The 15M Intraday Chart
Looking at the 15M Intraday Chart, Since dropping back into the trade range established in the support zone ($9,460.00 - $8,900.00), the formation appears to be exhausting demand at the middle and lower ends of support, which is expected in Phase D of a Wyckoff Distribution.
“Phase D arrives after the tests in Phase C show us the last gasps of demand. During Phase D, price travels to or through TR support. The evidence that supply is clearly dominant increases either with a clear break of support or with a decline below the mid-point of the TR after a UT or UTAD. There are often multiple weak rallies within Phase D; these LPSYs represent excellent opportunities to initiate or add to profitable short positions. Anyone still in a long position during Phase D is asking for trouble.” - The Wyckoff Method: A Tutorial
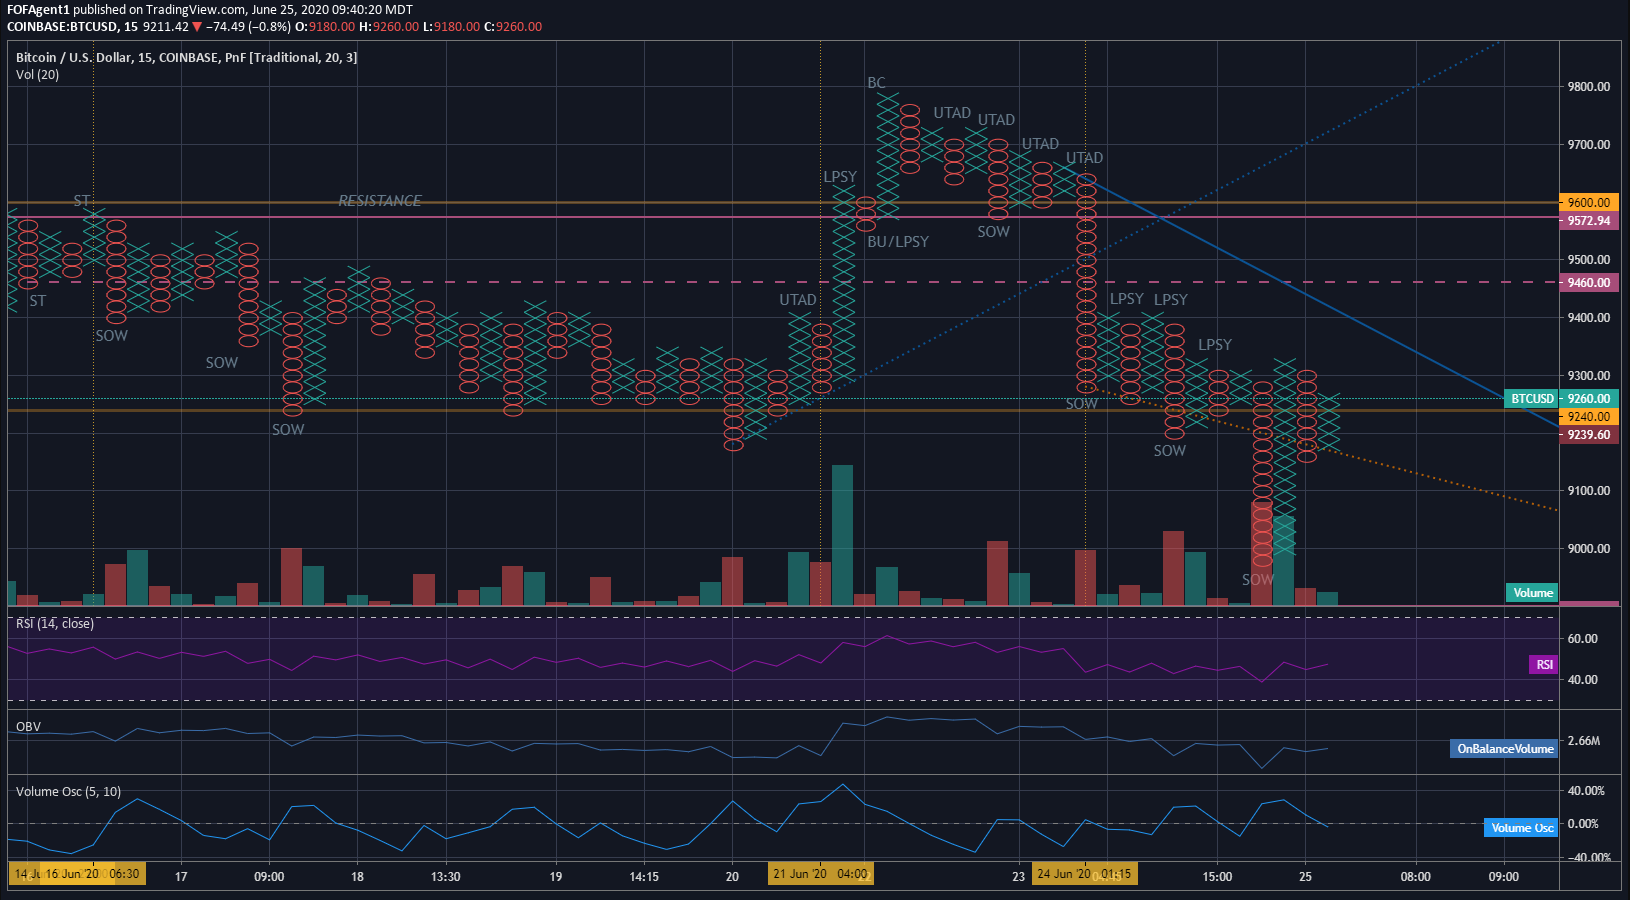
After breaking through the upper level of support at the $9,460.00 price handle on a Sign of Weakness (SOW), the PA printed another Bearish Line of Support, and subsequently printed another Sign of Weakness (SOW) on a Descending Triple Bottom to the $9,200.00 price handle. After a brief recovery above the Bearish Line of Support, the PA smashed through the Bearish Line of Support again with a very strong move to the $8,980.00 price handle and established another Sign of Weakness (SOW) before recovering above the Bearish Line of Support once again. It’s very clear the purpose of these moves is to exhaust all remaining demand in this price region. As of this writing, the PA on the current weak rally appears constrained below the key line of resistance at $9,240.00.
I would expect another strong move or cluster of moves to push PA down into the $8,900.00 price region in the near future to exhaust all remaining demand in that region, test/break the lower end of support at $8,900.00, and transition into Phase E for a Selling Climax (SC).
The 4H Intraday Chart
Looking at the 4H Intraday Chart, after the bearish breakdown from the $9,600.00 price handle to the $9,260.00 price handle, the PA has been constrained beneath the $9,320.00 price handle, with large spreads and heavy sell volume, indicating significant supply has entered the market.
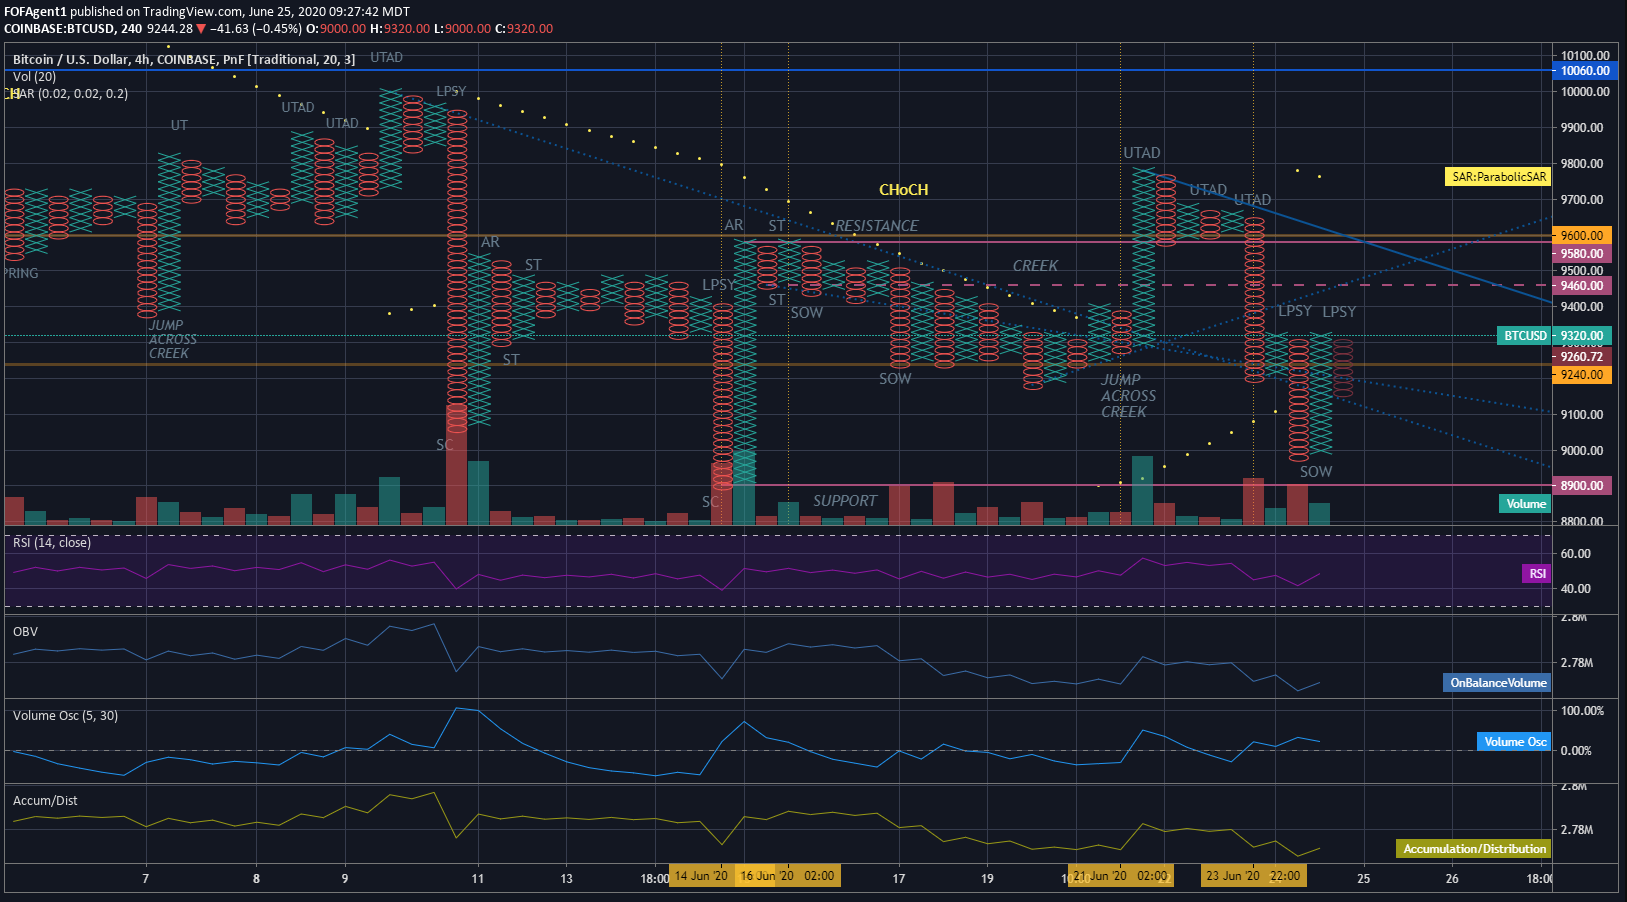
The formation appears to have established a Bearish Line of Support on the trend line formed from an Upward Thrust After Distribution (UTAD) at the $10,000.00 price handle. Ironically, that trend line once behaved as resistance. The PA smashed through this now Bearish Line of Support on a strong move down to the $8,980.00 price handle on a Sign of Weakness (SOW), before recovering above the Bearish Line of Support again.
Much like my earlier analysis in the $9,600 region, I would expect the formation to print another green candle (potentially two), as it moves downward in the support zone before breaking support at the $8,900.00 price handle and moving into Phase E and a final Selling Climax (SC).
The 1D Chart
On 1D chart, after forming a “Creek” of descending PA and increased volume, the Upward Thrust After Distribution (UTAD) signaled a move into Phase C of a Wyckoff Distribution (again arguably the most volatile of the Wyckoff Phases).
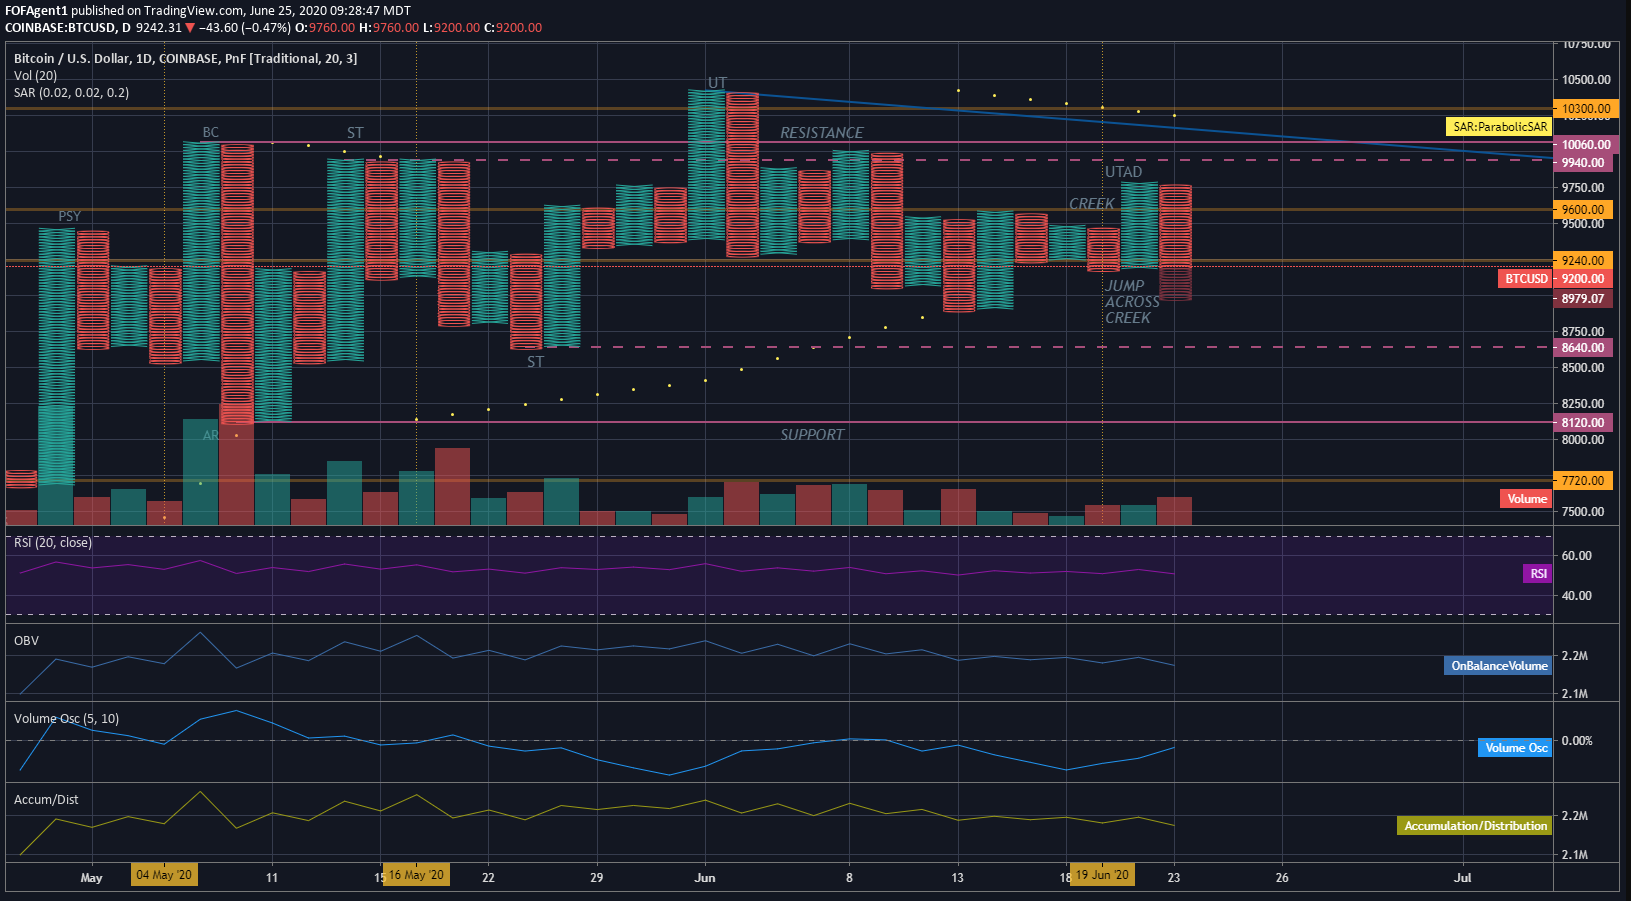
Two key items of note: (i) the Upward Thrust After Distribution (UTAD) which formed at the Jump Across the Creek, failed to rise to at least the lower line of resistance at the $9,940 price handle, and (ii) the current cause built into the formation at the Intraday level suggests the current red candle should complete at the $7,900.00 price handle and establish a Sign of Weakness (SOW) at a macro level. Should the PA fall below the lower level of support at $8,120.00, this would signal confirmation a Wyckoff Distribution (not Re-Accumulation) is underway at a macro level. This second point is significant as the remainder of the formation plays out at the macro level.
Also recall, since the formation is in Phase C, Upward Thrusts After Distribution (UTAD) are normal and should be expected. It is possible we could see a move higher to $10,420 after the current Intraday Distribution cycle exhausts the current cause.
Generally speaking, Wyckoff Accumulation and Wyckoff Distribution waves happen in cycles of three. As this current distribution wave is the third consecutive wave in this series, I would anticipate accumulation and a rally in PA at the conclusion of this current cycle.
Summary/Trade Plan
I’ve currently taken short positions within the $9,680.00 - $9,650.00 region and the $9,400 - $9,300 range. I would look to add to my short position with weak rallies in the support zone (potentially between the $9,300 - $9,200 range), and shift Stops from the $9,510.00 price handle to the $9,470 price handle. The Target Price for the Selling Climax (SC) would be $7,940.00 (additional cause has been added to the formation during this Wyckoff Phase D). I would look to begin covering shorts at or near the $8,300 price handle layering buys through $7,940.00, reserving approximately 15% for a potential blow off bottom and potential bottom sell.
At the Selling Climax (SC), I would look for a scalp long to catch the Automatic Reaction (AR) from the Selling Climax (SC) once the Low Pole Reversal Confirms – potentially somewhere in the $7,900 - $7,700 region. This would also be an excellent place for long term cold storage buys. Once the Automatic Reaction (AR) is exhausted, I would sell off any scalp long buys immediately and wait for the formation to move into the conclusion of Wyckoff Phase B/start of Wyckoff Phase C to take a position again.
Always remember this is not trading advice.
Outside of that, Happy Trading.
Posted Using LeoFinance