Happy Monday. Well, that escalated quickly.
The 15M Intraday Chart
Looking at the 15M Intraday Chart, that breakdown below $9,000 to the $8,900 price handle took virtually no time at all for a Wyckoff Distribution.
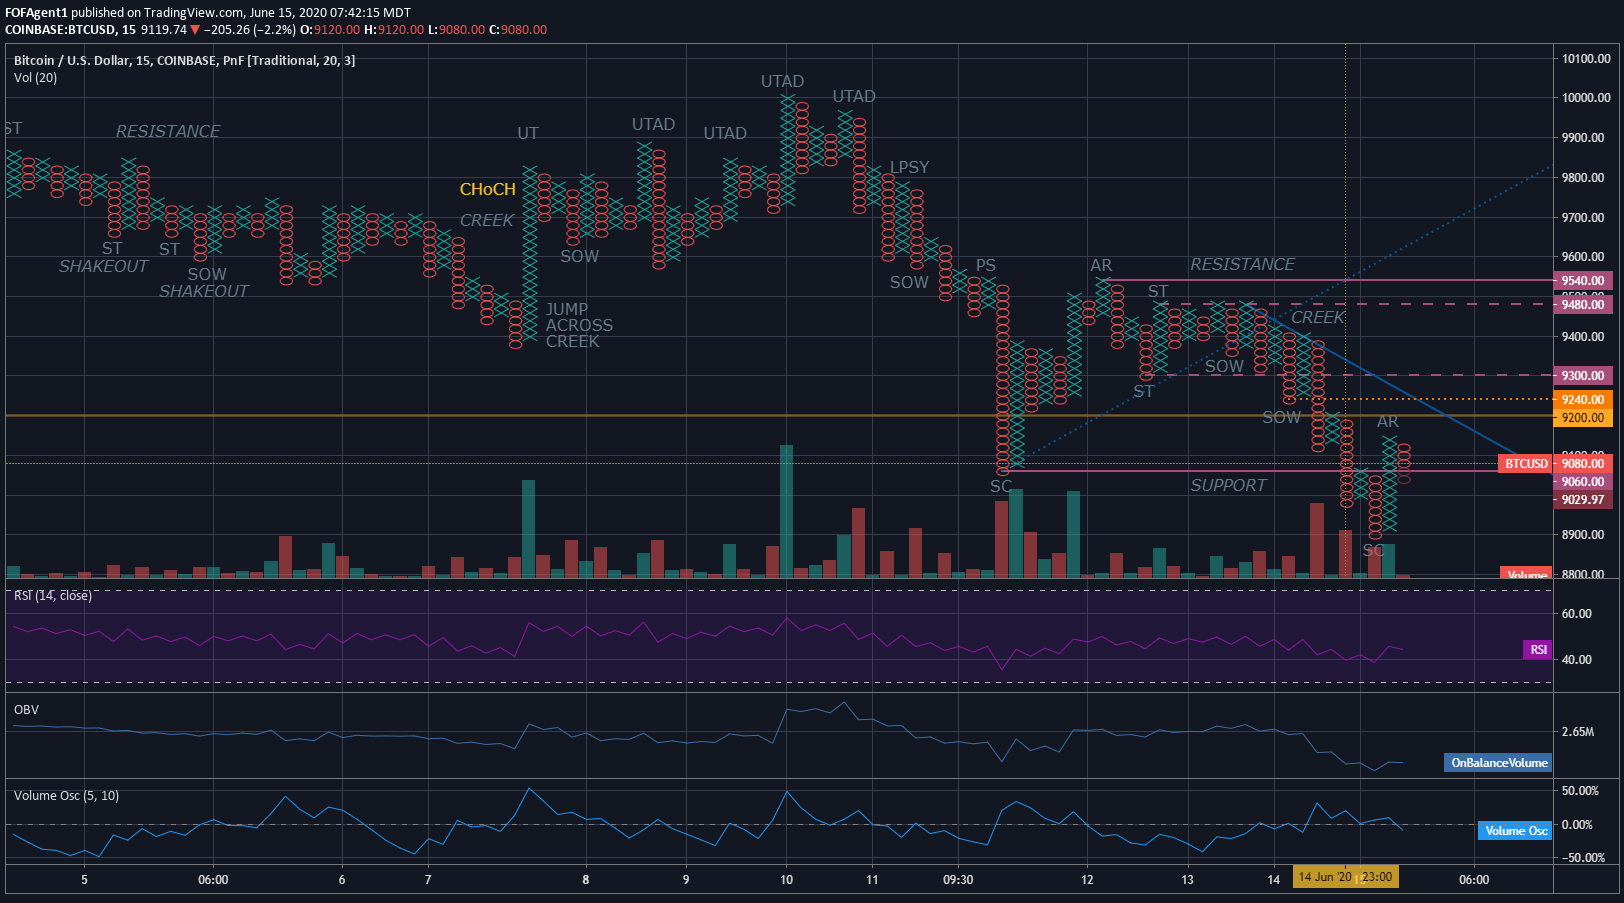
The PA for the formation could never break above the $9,480 price handle, even on successive attempts on very anemic volume, which signaled a move lower appeared to be in play. The PA spreads to the downside became much larger as the formation progressed, and printed a Sign of Weakness (SOW) once the PA broke through the line of support established by the Selling Climax (SC) established in Phase A at $9,060.00, also signaling a move lower appeared to be in play.
As the formation developed into a Creek, the expectation is it will create a quick succession of lower lows until it meets a surge of demand, then explode upward on an Upward Thrust (UT) towards resistance (a Jump Across the Creek), and the PA will either break through resistance on a move higher or experience rejection at or below resistance and fall lower. The expected Jump Across the Creek was incredibly anemic, was rejected after rising only four boxes at the $9,200 price handle, and turned lower in a cascading Selling Climax (SC) to the $8,900 price handle, exhausting all the cause built into the formation.
The formation is currently in a Phase A Wyckoff Accumulation range after completing the most recent distribution, and it is currently establishing the trade range for the next part of this larger macro Wyckoff Distribution underway. One particular item of note thus far: both the price-spread and volume appear anemic on the Automatic Reaction (AR) stage of this Phase A Accumulation. With the formation remaining solidly under the trend line established at $9,480.00 one must maintain a bearish bias until that trend line is broken.
The 4H Intraday Chart
Looking at the 4H Intraday Chart, the formation remained solidly underneath both the lower resistance range at the $9,480 price handle and solidly underneath the trend line established at the final Upward Thrust After Distribution (UTAD) established at the $10,000.00 price handle before entering a Selling Climax (SC) dropping the PA to the $8,900 price handle.
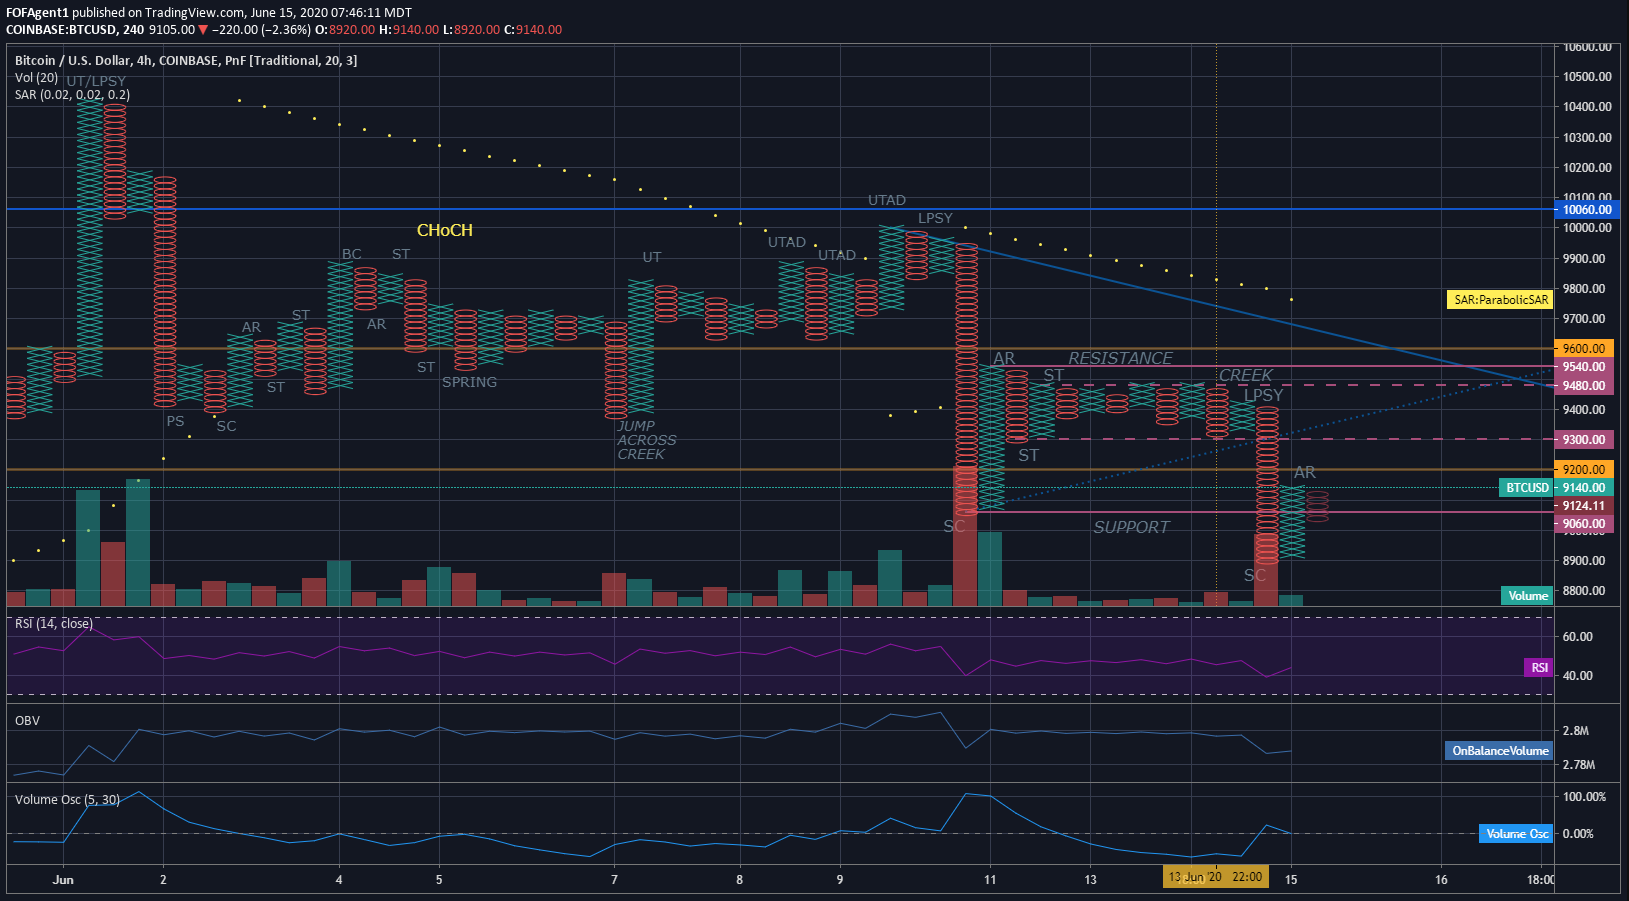
After the formation broke through trend line support established at the Selling Climax (SC) at the $9,060 price handle, the Sign of Weakness (SOW) turned into a Selling Climax (SC) with virtually no demand to counteract the selloff. The selloff continued and exhausted all the cause built into the formation once the $8,900 price handle was realized.
Two key takeaways with the 4H Intraday chart (i) both the price-spread and volume appear anemic on the Automatic Reaction (AR) stage of this Phase A Accumulation suggesting weak demand in this price range at this stage, and (ii) the PA remains solidly underneath the trend line established at the final Upward Thrust After Distribution (UTAD) established at the $10,000.00 suggesting a bearish bias unless the trend line is broken.
The 1D Chart
Looking at the 1D chart, the formation remains within Phase B of a normal Wyckoff Distribution. The PA of the formation has remained in the midpoint of the trade range while trending lower and is currently pushing lower inside of a red daily candle.
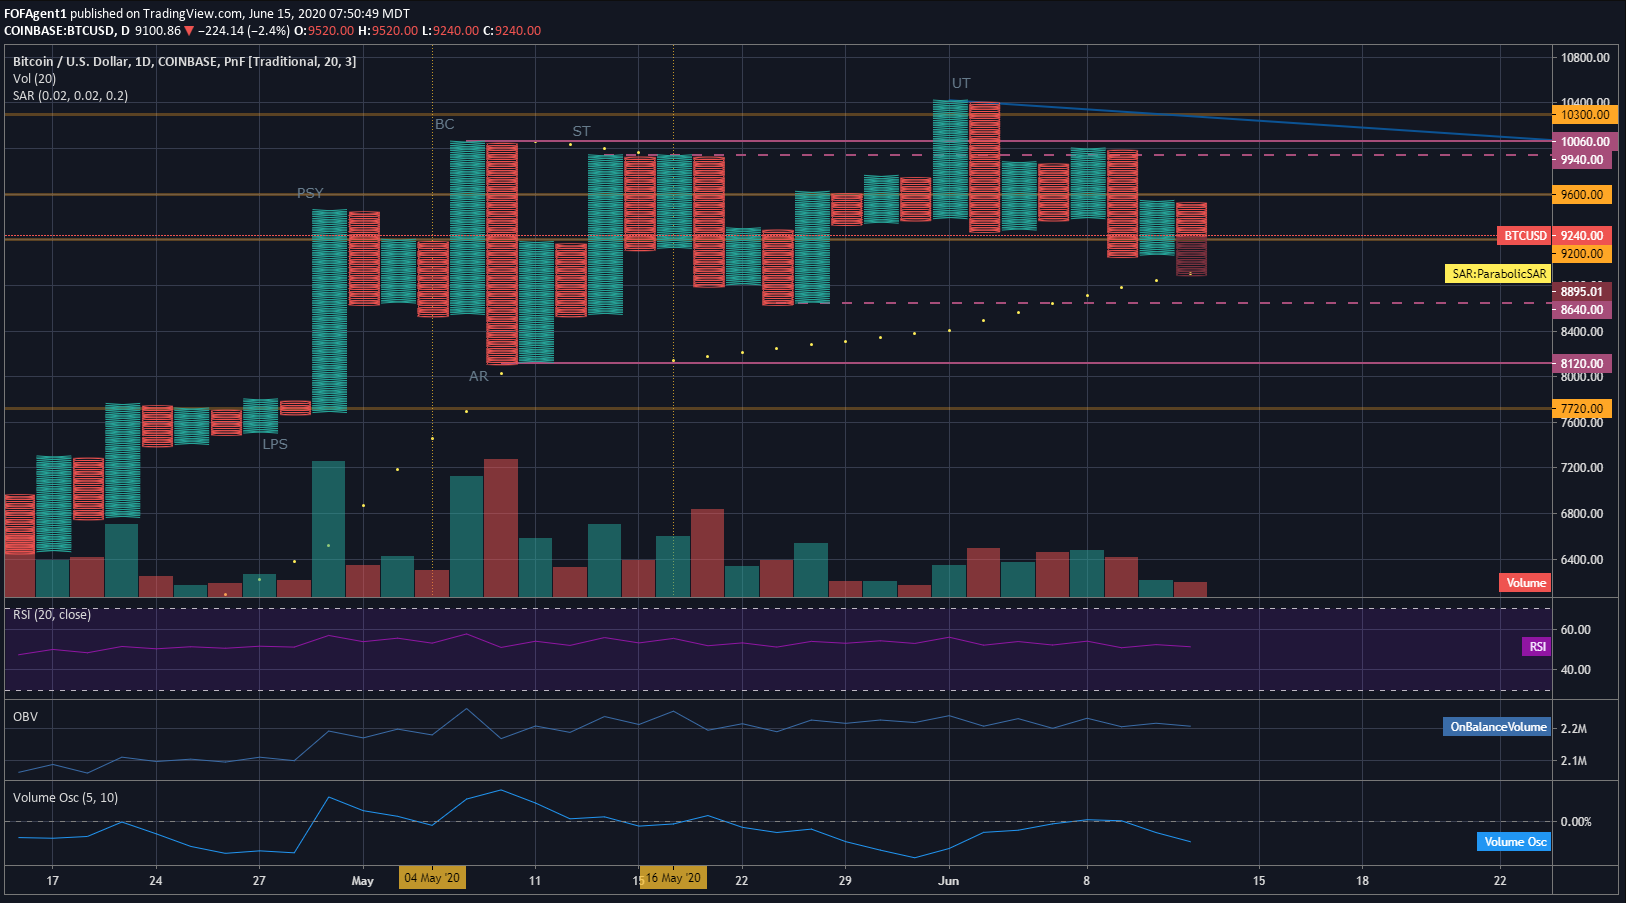
Typically, after a Phase B Upward Thrust (UT), the formation will begin to print lower highs as large interests are net sellers of Bitcoin and have the goal of exhausting as much of the remaining demand as possible and moving into Phase C.
In the current formation, a Phase B Upward Thrust (UT) was printed at the $10,420 price handle. Since then, the PA has gradually pulled back to the $9,060 price handle. My expectation is the 1D formation should continue to print lower highs over the near term and move lower towards the bottom of the trade range to the $8,120.00 price handle (and potentially establish a Sign of Weakness (SOW) before moving into Phase C of the Wyckoff Distribution. Phase C is arguably the most volatile phase, which could propel the formation to higher highs on successive Upward Thrusts After Distribution (UTAD) before moving into the final distribution phases and pushing price down below the lower support handle at $8,120.00 in a bid to complete the cycle.
On the 1D, two key items of note: (i) volume is currently trending downward as the PA moves lower, suggesting we may be coming close to the bottom of this move down, and (ii) the Volume Oscillator has moved into negative territory and printed a significant negative value (-17.54%), suggesting a trend shift is imminent. If I were to hazard a guess, it would appear we may have between 1 -2 more macro moves down before the trend should reverse again. Typically, strong reversals occur when the Volume Oscillator prints values above 30%.
I would imagine in the near term another move down after consolidation would be the likely scenario. The PA and volume spreads paint a picture of very anemic demand in the region at this stage. However, one needs to see how things unfold during consolidation at this trade range before taking a position.
Always remember this is not trading advice.
Outside of that, Happy Trading.
Posted Using LeoFinance
Very nice post full upvoted vy the @hodlcommunity.
Check out our account and nice community ;)