Happy Wednesday. It would appear my thoughts about the formation printing a bull trap were correct, and the recent drop signaled the conclusion of Phase C and entry into a Phase D Wyckoff Distribution pattern.
The 15M Intraday Chart
Looking at the 15M Intraday Chart, it appears as though the Sign of Weakness (SOW) printed at the break of the Bearish Support Line on a Descending Triple Bottom signaled an incoming drop back into the trade range established inside the support zone as expected.
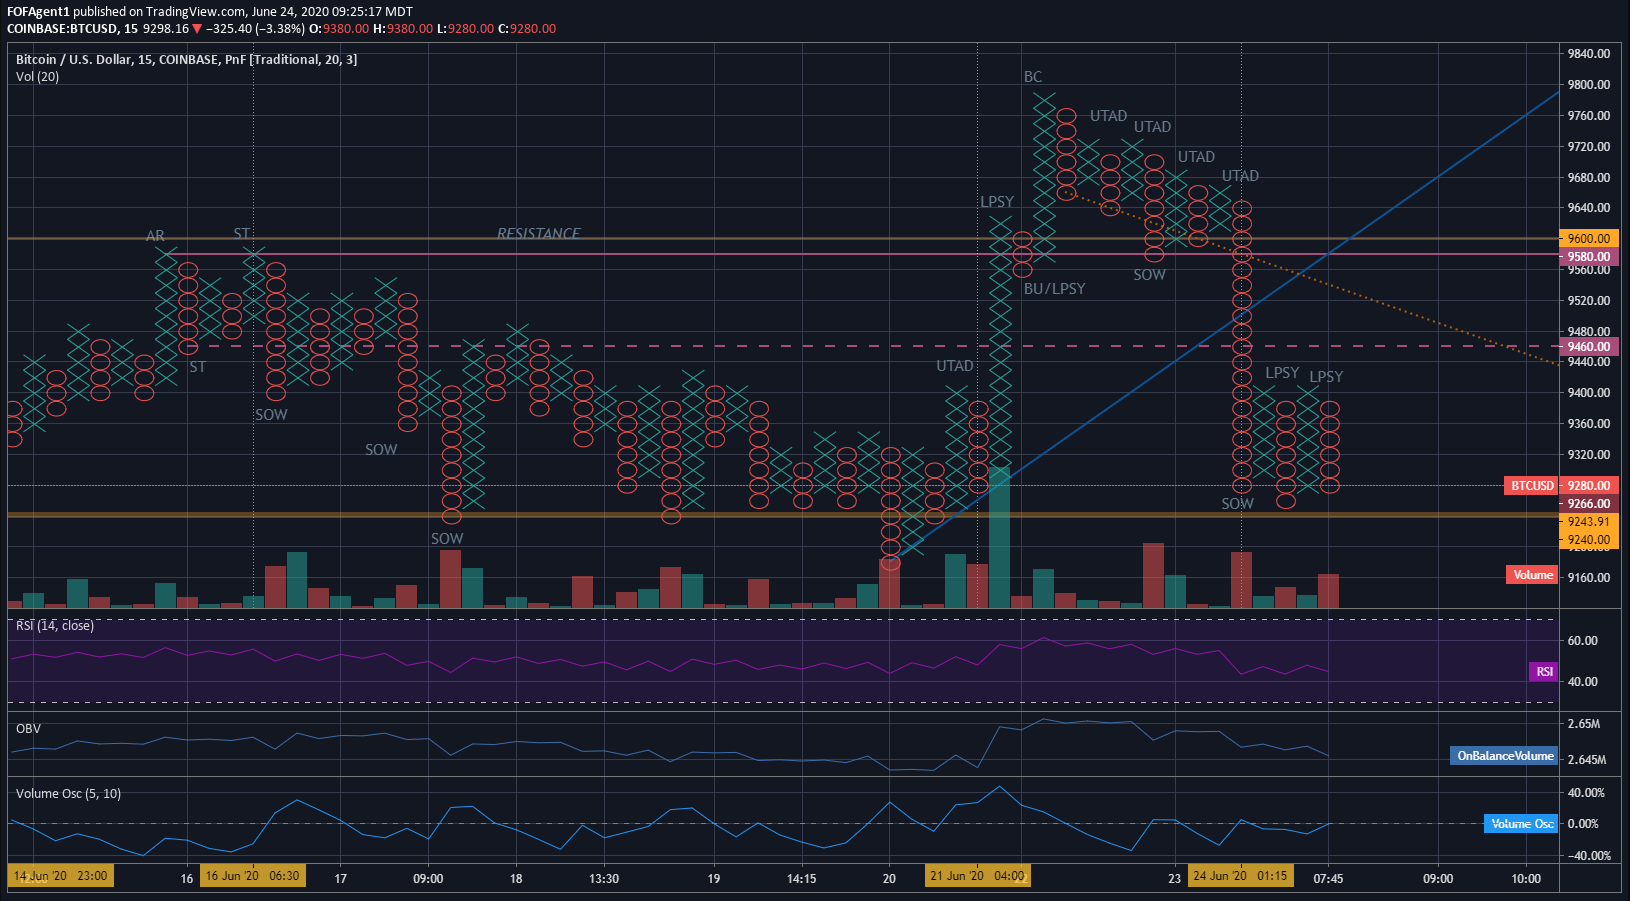
It would appear the red flags around the failure to exhaust the cause on the move up were warranted, and the formation played out as anticipated in Phase C. After the Buying Climax (BC) at $9,580.00, the formation painted a series of Upward Thrusts After Distribution (UTAD) with declining volume as demand at the $9,600 price handle was exhausted. A Bearish Line of Support was formed with the lower lows and a Sign of Weakness (SOW) was printed at the $9,580.00 price handle from a Descending Triple Bottom off the Bearish Trend Line. This signaled the supply coming to market was disproportionately overwhelming demand and move lower was in play.
A steep drop in PA back into the mid-range of support signaled the conclusion of Phase C and a Phase D Wyckoff Distribution has commenced. During Phase D, we should expect the price to remain below upper support at the $9,460 price handle and gradually move lower through the range before coming to the bottom of support at the $8,900.00 price handle. Any rallies within Phase D should be on weak volume and provide excellent opportunities to take a short position or add to a current short position. Once the low end of support breaks, this will signal Phase E, and a Selling Climax (SC) exhausting all the cause built into the formation should ensue shortly after.
The 4H Intraday Chart
Looking at the 4H Intraday Chart, the bearish breakdown from the $9,600.00 price handle to the $9,260.00 price handle, unambiguously signaled the formation has entered Phase D of a Wyckoff Distribution.
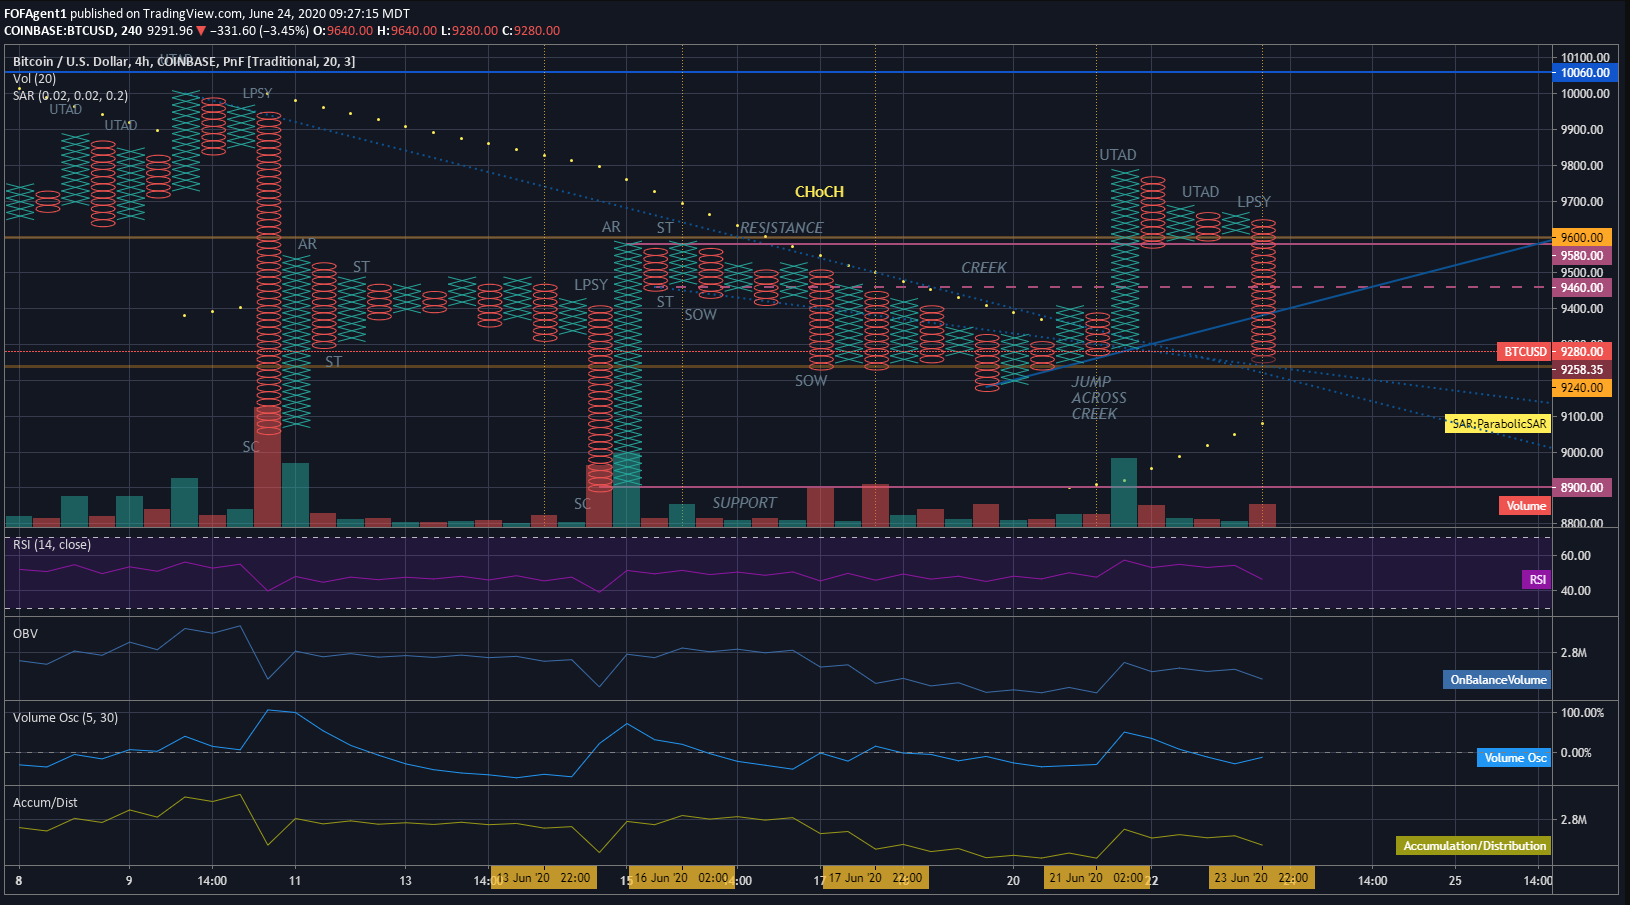
The formation broke through the support trend line which was established at the low point of the creek at the $9,200.00 price handle. This decisive break printed both a Sign of Weakness (SOW) and flipped the bias from bullish to bearish on the 4H Intraday chart.
I would expect the formation to print a green candle, potentially two, as it moves downward in the support zone before breaking support at the $8,900.00 price handle and moving into Phase E. That being said, in this area, I would focus more of my attention on the 15M Intraday, since that appears to be driving where Last Points of Supply (LPSY) are forming as we march towards a Selling Climax (SC).
On the fundamental side, it appears the coins from the spike in Miner Outflows reported by Onchain Analyst Cole Garner, have hit the exchanges in this recent selloff based upon reports from cq.live. Thanks to Tradingview user @derrybit for sharing that piece of info.
The 1D Chart
On 1D chart, after forming a “Creek” of descending PA and increased volume, the Upward Thrust After Distribution (UTAD) signaled a move into Phase C of a Wyckoff Distribution (again arguably the most volatile of the Wyckoff Phases).

Something of note - the Upward Thrust After Distribution (UTAD) which formed at the Jump Across the Creek, failed to rise to at least the lower line of resistance at the $9,940 price handle. This would suggest supply has entered the market which is disproportionately greater than demand at this price range, and lower PA should be on the table soon. However, since the formation is in Phase C, Upward Thrusts After Distribution (UTAD) are normal and should be expected. It is possible we could see a move higher to $10,420 after the current distribution cycle exhausts the current cause.
Generally speaking, Wyckoff Accumulation and Wyckoff Distribution waves happen in cycles of three. As this current distribution wave is the third consecutive wave in this series, I would anticipate accumulation and a rally in PA at the conclusion of this current cycle.
Summary/Trade Plan
I’ve currently taken short positions within the $9,680.00 - $9,650.00 region. I would look to add to my short position with each weak rally in the support zone, potentially between the $9,400 - $9,300 range, and shift Stops from the $9,730.00 price handle to the $9,510 price handle. The Target Price for the short position would be $8,760.00 (additional cause has been added to the formation).
At the Selling Climax (SC), I would look to target the $8,680.00 price handle for a scalp long to catch the Automatic Reaction (AR) to the Selling Climax (SC). Once the Automatic Reaction (AR) is exhausted, I would sell off immediately and wait for the formation to move into the conclusion of Wyckoff Phase B/start of Wyckoff Phase C to take a position again.
Always remember this is not trading advice.
Outside of that, Happy Trading.
EDIT - Due to recent LPSY topping out at $9,300 price targets must shift as well. Target Price to cover the short position shifts significantly to $8,320, and Target Price for the Automatic Reaction (AR) shifts to $8,270.
You can follow me and keep up to date on Tradingview as well. I trade under the handle FOFAgent1 at tradingview.com
Posted Using LeoFinance