Happy Wednesday. I mentioned yesterday the appearance of an Upward Thrust (UT) to the $9,180.00 price handle during what I assumed was a continuation of a Phase D Wyckoff Distribution threw a ton of red flags. After publishing my analysis Monday, I noticed the volume profile and PA did not line up with a Phase D Distribution, and the Selling Climax (SC) did not exhaust the cause from consolidation in the formation - which threw even more red flags. Once the formation printed an Upward Thrust (UT) on the 4H Intraday to the $9,220.00 price handle, it confirmed a Secondary Test (ST) of resistance for the new trade range, and confirmed we are now in a Phase D Wyckoff Accumulation. I have subsequently covered all short positions at the $9,085.00 price handle.
As the Phase D Wyckoff Accumulation concluded and the formation attempted a breakout, volume continued to be an issue, the cause from consolidation again failed to be exhausted, and the breakout failed to have any follow-through. As a result, new short positions have been taken within the $9,160.00 – 9,180.00 price range and the $9,250.00 - $9,270.00 price range.
Failure to exhaust cause from consolidation (target prices failing to be reasonably hit) in either direction is now a major problem in the $9,000.00 price region, and the activity around the $9,000.00 price handle could right before Options Expiry could be the reason.
The scope of the TA will again be limited to the Intraday Charts (15M and 4H). With that, let’s get to the TA…
The 15M Intraday Chart
Looking at the 15M Intraday Chart, after signaling a Change of Character (CHoCH) with a clear break above the upper resistance line at the $9,180.00 price handle on a Sign of Strength (SOS), the formation retreated into a Back-Up/Last point of Support (BU/LPS) right under the $9,180.00 resistance line to consolidate for a move higher.
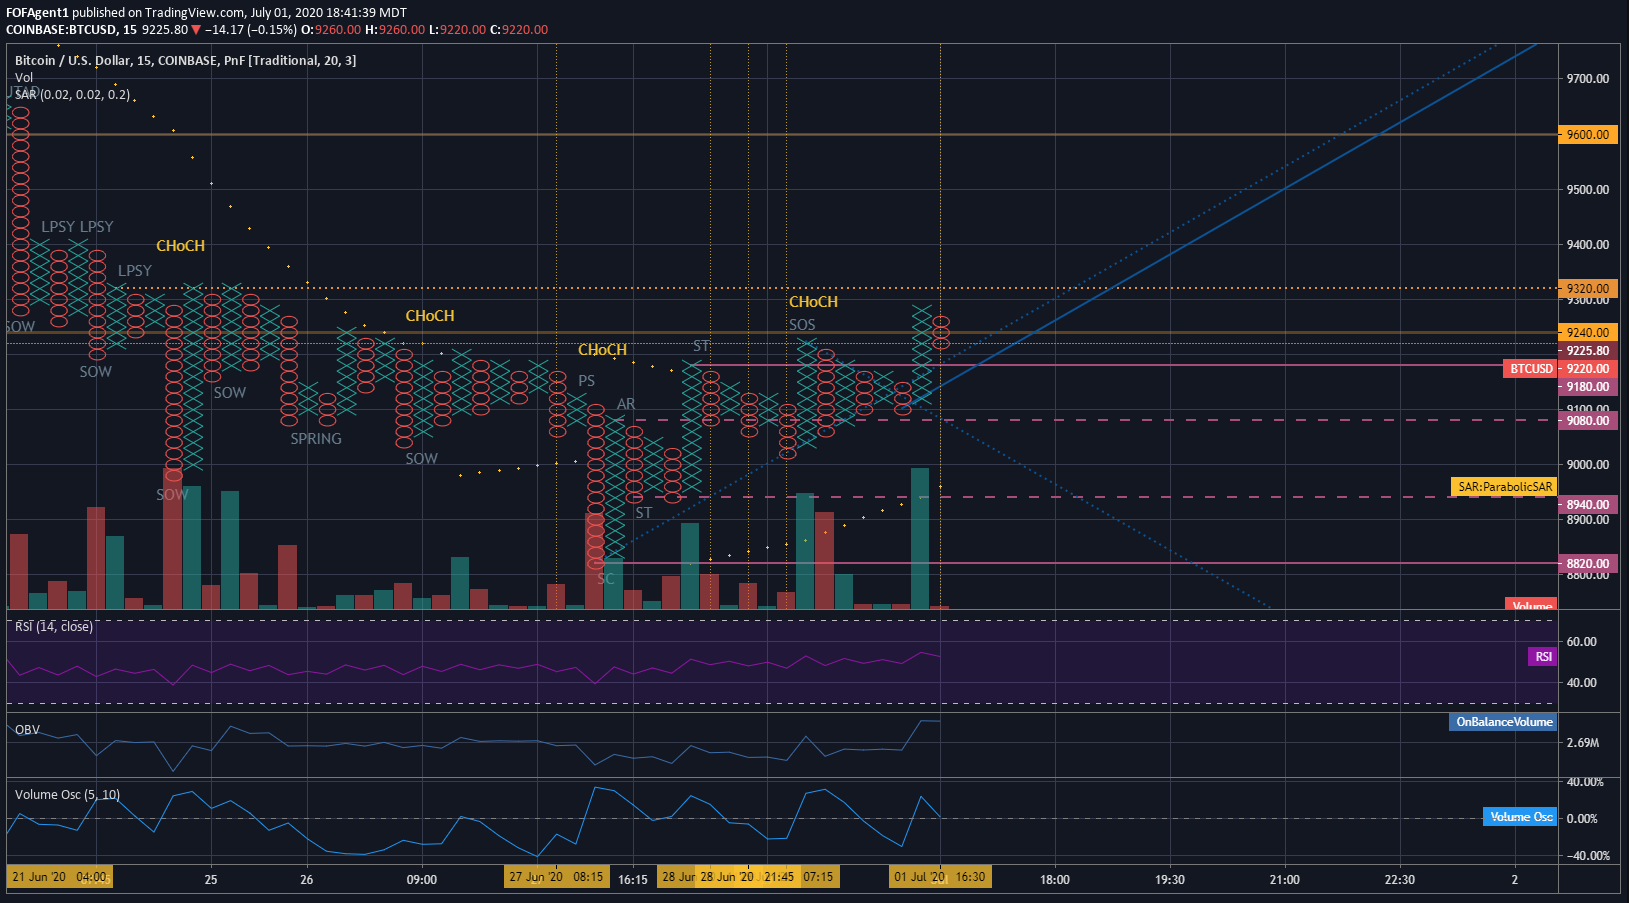
Typically, the behavior one would expect to see with PA spreads and volume during a Phase D Wyckoff Accumulation are:
“…the consistent dominance of demand over supply. This is evidenced by a pattern of advances (SOSs) on widening price spreads and increasing volume, as well as reactions (LPSs) on smaller spreads and diminished volumes.”
Phase D (to this point) has been a story of declining/compressed PA spread and trade volume, with the notable exception of the bookend Signs of Strength (SOS). When comparing the trade volume profile of this current Phase D Wyckoff Accumulation to recent Phase D Accumulations, the trade volume is roughly half of what has historically been present. The follow through on this breakout has been conspicuously absent, with initial breakout falling short of the $9,320.00 resistance line.
The pullback from that initial advance has managed to stay above the resistance line at the $9,180.00 price handle. Bullish breakout would confirm should the PA break past the $9,340.00 price handle.
The 4H Intraday Chart
Looking at the 4H Intraday Chart, the PA broke trend line resistance with a move to the $9,280 price handle on a Sign of Strength (SOS). This flipped the 4H Intraday bias from bearish to bullish.
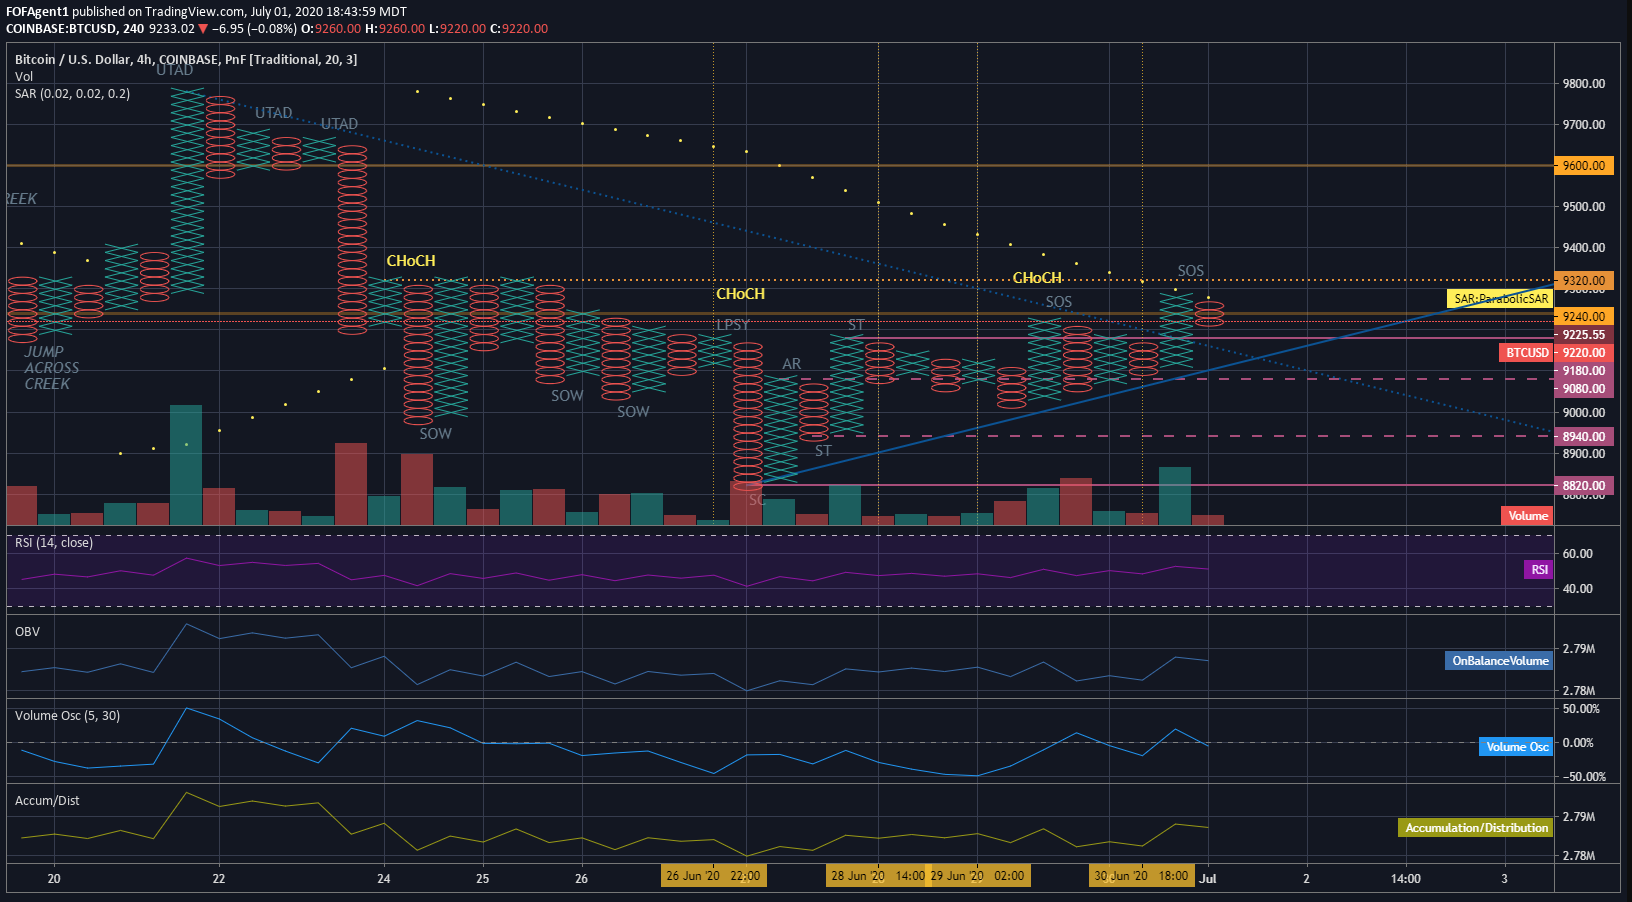
Trend line support currently falls within the resistance range, which on its face, has some bullish overtones. The PA spreads, activity and trade volume all mirror the activity on the 15M Intraday. As with the 15M Intraday, the PA has pulled back to a price range above the upper resistance line at the $9,180.00 price handle, suggesting a breakout is imminent at the time of this writing.
On the surface, it has the appearance of a bullish bias, but the PA behavior and volume is very atypical for a formation moving into a Phase E Wyckoff Accumulation (breakout). It seems they paint the picture of bullish exhaustion rather than imminent bullish breakout. I’m left with the impression of a bull trap again.
Summary/My Trade Plan
All open short positions were covered at $9,085.00 to lock down profits given the appearance of a Wyckoff Accumulation Trend in Phase D.
As the Phase D Wyckoff Accumulation trend played out: (i) the volume did not appreciate during consolidation within the resistance range on PA increases (X Columns) – volume basically declined/remained flat, (ii) volume did not appreciate as expected on the breakout above the $9,180.00 resistance line, (iii) the PA did not follow through after the initial advance to $9,280.00, and (iv) the formation has failed to exhaust the cause built into the formation, regardless of breakout/breakdown. New short positions were taken within the $9,160.00 – 9,180.00 price range and the $9,250.00 - $9,270.00 price range. Current Target price is $8,760.00 and Stops are set for $9,310.00.
Right before Options Expiry on Friday, it was reported there was a significant increase in activity at the $9,000.00 price handle for options. Should my bearish bias prevail and the news around Options PA prove to be true, the PA collapse should be significant and should dive materially lower that the Target Price. Given the formation still has unresolved cause built into it, the plan is to scale short coverage from $8,760.00 - $7,700.00 price range.
Always remember this is not trading advice.
Outside of that, Happy Trading.
You can follow me and keep up to date on Tradingview as well. I trade under the handle FOFAgent1 at tradingview.com
Posted Using LeoFinance
Great analysis. I have a similar bearish bias for the time being and am waiting to accumulate around the $8k level. I’m not a short-seller of BTC, but I am glad to pick up on the dips
Posted Using LeoFinance
@khaleekazi thanks for taking some time to check out the analysis and comment. I appreciate it. I can respect your decision to wait until the selling climax completes before taking a position.
Often times when I speak to people and tell them I am bullish on Bitcoin, the immediate reaction is, then why are you shorting it? The implication of course being you can only be of binary mind (either bear or bull).
I once heard something which changed my perspective on trading, and moved me into swing trading. "The goal of a trader who sees value in an asset should be to acquire as much of that asset as possible." On its face, that statement would seem to imply only buy the asset at the lowest price possible to acquire more. In my mind, that limited perspective removes some very significant tools from the toolbox: sell high/acquire more low and shorting the asset you want to acquire more low.
Exchanges of assets always involve a form of Gresham's Law - currencies of no perceived value crowd out currencies of higher perceived value from marketplaces. Also, I'm of the mindset intrinsic value does not exist - I believe perceived value is the only "form" of value and it's highly contextual.
Ideally, a trader would seek to acquire large sums of low perceived value transactional currency (such as USD) to acquire higher perceived value assets (such as Bitcoin). A swing trader would seek to profit off changes in perceived value in the targeted asset to acquire more of the target asset - so shorting the asset they seek to acquire more of when the perceived value of the asset shifts relative to another makes a ton of sense.
I suppose it's a long winded way of saying learning how to place high probability of success shorts may help you acquire more Bitcoin more quickly. Thanks again for taking some time to check it out and comment.