
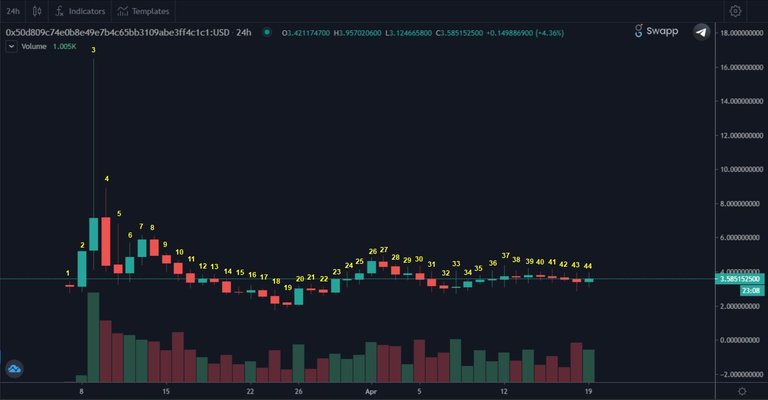
Today I will be doing a technical analysis of the cub, I will try to track the price movement from the beginning and for that I will be using the 24-hour time graph or D1 and smaller graphs to more closely analyze certain movements, and also a candle counter that I made the hand.
Due to the depth of the analysis I intend to bring, this will be part one, if you are interested I bring the continuation in the meantime we can discuss in the comments.
My analysis is based on several techniques that I have learned over the years doing trade.
But the basis is:
Price action - Al Brooks
Elliott waves
Wyckoff cycles
Dow Theory
First let's start from the beginning, I hope you like it.
The first candle does not have an expressive movement so we can use it only as a reference of an initial movement taking its minimum and maximum history.
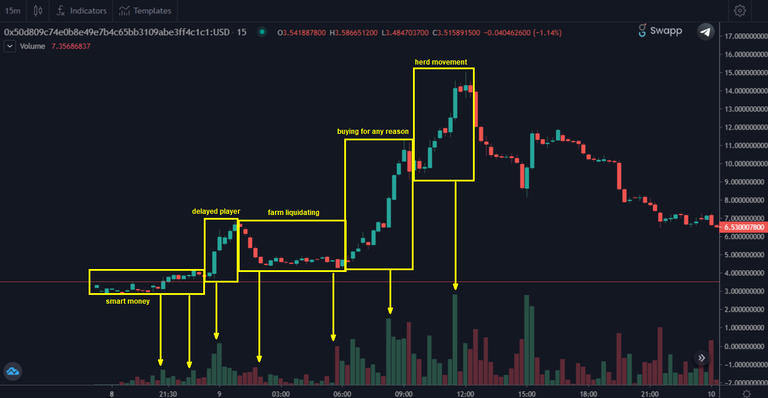
Candle two breaks the top end of candle one which may mean the beginning of a bullish trend, as we still don't have a price history, we can believe that it is a purely speculative movement by the players who were already waiting for the opening of the asset, and knew of the possibility of the high farm rate before a possible halving. those first to position themselves can be considered smart money.
candle two closes with no upper wick, at that moment due to the high appreciation we have two scenario perspectives for candle three ...
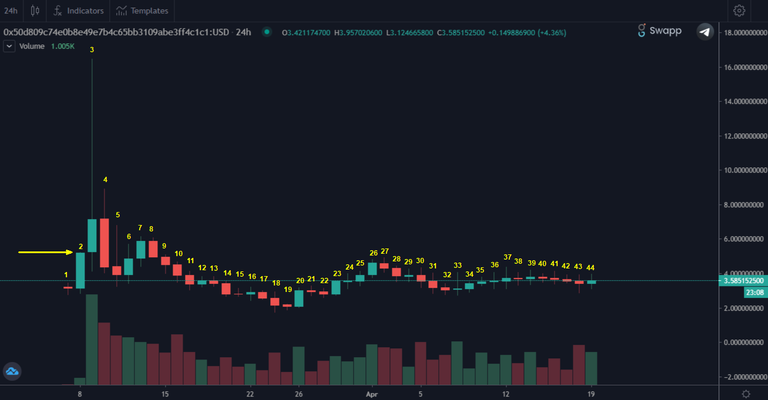
The first scenario, even without having a price history, could be a "buy for any reason" where those who were unable to position themselves during candle one and were also unable to enter when candle two broke the maximum of candle one would be at that moment with the intention of purchase.
On the other hand, we have the smart money that is already positioned either on candle one or during the breach of candle two, the more conservative could be with the intention of liquidating part of their positions on candle three or part of their farm.
I believe that players with both intentions came into conflict which would justify the lower wick in candle three with smart money liquidating part of their positions or farm, and the more "backward" buying for any reason providing liquidity for those who wanted to get rid of their position and part of the farm that he had already acquired.
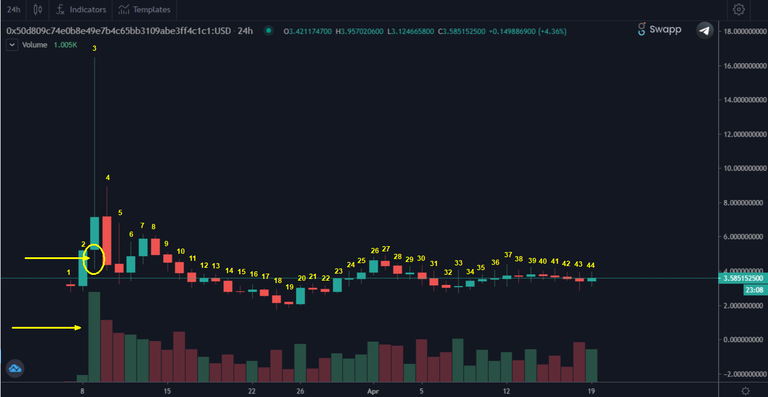
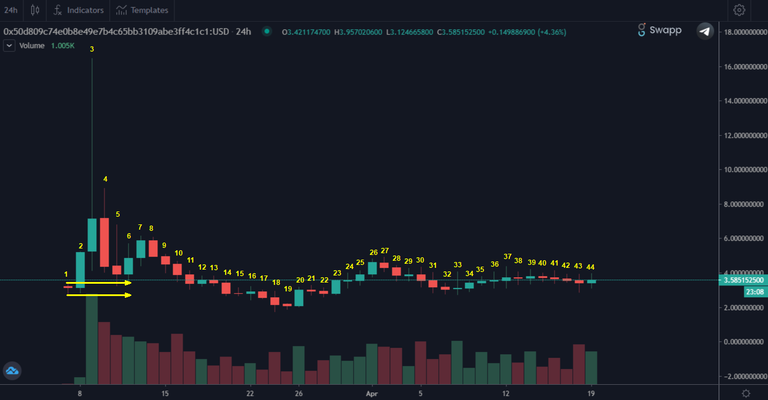
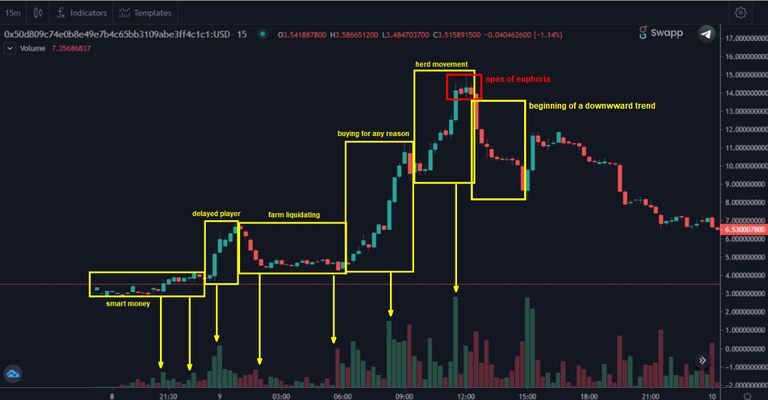
We can confirm this analysis by the 15m chart and deepen it, seeing things that were imperceptible in the 24h chart. we can see the smart money positioning itself in the opening, then the "most backward" comes with buying force, forcing part of the smart money to sell positions or the result of its farm to satiate the liquidity of the most backward which makes the price go up in one first, after this small euphoria, we may have a farm liquidation period and some of the positions, causing this short bearish period, which ended when other players saw the great opportunity to profit from the high farm rate, which back to the beginning of a bullish trend marked by the breaking of candle two of the 24hr chart giving the trigger of "buy for any reason" that quickly turns into a "herd movement" where the euphoria of the excessive price hike was not more sustainable. at that moment the "smart money" and the "most backward" that are now not so far behind, start to liquidate their positions with a profit of several times the capital invested, sustained by the liquidity of the "herd" that was taken by the greed of the rise exponential.
After the apex of euphoria, the market once again confirms the wyckoff theory followed by the beginning of a downward trend
But the continuation I will talk about in part two, if you agree with my analysis so far, like it and want me to continue leave your comment or an upvote that I will be bringing the full report of the price of the cub and my predictions of where price can go based on technical fundamentals.
Thank you very much if you read this far and sorry for the bad English
Versão em português
Hoje vou estar fazendo uma analise tecnica do cub, eu tentarei rastrear a movimentação do preço desde o inicio e para isso estarei usando o tempo grafico de 24 horas ou D1 e graficos menores para analisar mais de perto determinados movimentos, e tambem contador de candles que fiz a mão.
Devido a profundidade da analise que pretendo trazer, essa sera a parte um, se voces tiverem interesse trago a continuação enquanto isso podemos discutir nos comentarios.
Minha analise se baseia em varias tecnicas que aprendi ao longo dos anos fazendo trade.
Mas a base é:
Price action - Al Brooks
Elliott waves
ciclos de Wyckoff
Teoria de Dow
Primeiro vamos começar do inicio, espero que voces gostem.
O primeiro candle não tem uma movimentação expressiva então podemos ultiliza-lo apenas como referencia de um movimento inicial pegando sua minima e maxima historica.
O candle dois faz um rompimento da extremidade superior do candle um o que pode significar o inicio de uma tendencia de alta, como ainda nao temos um historico do preço, pode-mos acreditar que é um movimento puramente especulativo pelos players que ja estavam aguardando pela abertura do ativo, e sabiam da possibilidade da alta taxa de farm antes de um possivel halving. esses primeiros a se posicionarem podem ser considerados o dinheiro esperto.
o candle dois fecha sem nenhum pavio superior, nesse momento devido a alta valorização temos duas perspectivas de cenario para o candle três...
O primeiro cenario mesmo sem ter um historico do preço poderia ser um "comprar por qualquer motivo" onde quem não conseguiu se posicionar durante o candle um e tambem não conseguiu entrar quando o candle dois rompeu a maxima do candle um estaria nesse momento com a intenção de compra.
Em contra partida temos o smart money que ja esta posicionado seja no candle um ou durante o rompimento do candle dois, os mais conservadores poderiam estar com a intenção de liquidar parte de suas posições no candle três ou parte do seu farm.
Creio que players com ambas as intenções entraram em conflito o que justificaria o pavio inferior no candle tres com o smart money liquidando parte de suas posições ou farm, e o mais "atrasados" comprando por qualquer motivo fornecendo liquidez para quem queria se livrar de sua posição e parte do farm que ja tinha adquirido.
Podemos confirmar essa analise pelo grafico de 15m e aprofundar ela, vendo coisas que eram imperceptiveis no grafico de 24h. podemos ver o smart money se posicionando na abertura, em seguida os "mais atrasados" vem com força comprando, forçando parte do smart money a vender posições ou resultado de seu farm para saciar a liquidez dos mais atrasados o que faz o preço subir em um primeiro momento, após essa pequena euforia podemos ter um periodo de liquidação de farm e alguma parte das posições, causando esse curto periodo de baixa, que teve um fim quando outros players enxergaram a grande oportunidade de conseguir lucrar com a alta taxa de farm o que nos tras ao inicio de uma tendencia de alta marcada pelo rompimento do candle dois do grafico de 24hrs dando o gatilho de "comprar por qualquer motivo" que rapidamente se tranforma em um "movimento de manada" onde a euforia da alta exessiva do preço não era mais sustentavel. nesse momento o "smart money" e os "mais atrasados" que agora não estão tão atrasados assim, começam a liquidar suas posições com um lucro de varias vezes o capital investido, sustentados pela liquidez da "manada" que estava tomada pela ganancia da alta exponencial.
Após o apice da euforia o mercado confirma mais uma vez a teoria de wyckoff seguida pelo inicio de uma tendencia de baixa
Mas a continuação vou falar em uma parte dois, se voces concordam com a minha analise ate aqui, gostaram e querem que eu continue deixe seu comentario ou um upvote que vou estar trazendo o relatorio completo do preço do cub e minhas previsões de pra onde o preço pode ir baseado em fundamentos tecnicos.
Muito obrigado se voce leu ate aqui.
Posted Using LeoFinance Beta