Let me start like I always start these post with a disclaimer. I'm a multidisciplinary engineer with a strong background in data engineering, information security and dfir. I've spent quite some time learning about nutrition and nutritional epidemiology due to my own complicated health history and my desire to stay alive, but I don't have any formal qualifications in those fields. Regarding air flow dynamics, a subject I'll be touching on later on, its not a subject I'm an expert on, but its a subject I've studied back in the 80s while studying avionic engineering.
I'm nowhere close to being an expert on infectious disease. I feel I have a good grasp of the math involved in epidemiology though I'm a complete noob when it comes to most of the biological and medical aspects of the field that don't touch on either cardiovascular disease or nutrition. As such, if the below analysis is incorrect, it is likely the errors will be mainly of a biological nature.
Herd immunity, R0 and Rt
I've been watching the emerging #covid19 data closely on a daily basis, and so have many other people, both people with a medical and people with an engineering background can be seen communicating their views and insights on this subjects on a daily basis. Some analyses and models shared on social media align seamlessly with the data, some align good enough to be statistically viable models of reality, and some are just round out insane and don't align with the data at all. What most interpretations share however is a massive lack of appreciation of the uncertainty involved in fitting emerging data against a model of composite exponential waves.
Today I want to look at the idea of #herdimunity that has been getting a lot of supporters lately, not in the least amongst major influencers in the #LCHF realm. Its an idea also that has been, or at least seems to have been adopted by a great number of countries judging from the way they handle the current crisis. I want to stress that the subject of herd immunity is orthogonal to the discussion if a full on lockdown or a continued lockdown is a good policy. Herd immunity versus lockdown is a false dichotomy. The difference between a policy aimed at herd immunity and a policy aimed at alternate goals is dominated by a dynamic little number named Rt. Rt is the actual transmission rate at time t, and its really really important.
Much of the talk on reproduction rate of the virus has been on R0. Personaly I'm not sure why why anyone would bother with R0 when it's Rt that truly matters.
Consider Rt to be the outcome of a complex and unknown equation with a lot of variables. Some variables are influenced by government policies. Other variables are influenced by public attitude. And yet other variables are influenced by weather, climate, and other metrological patterns. One last yet very important variable in our hidden function is the portion of the population that has caught the virus, has recovered, and is now partially or completely immune from catching the virus a second time. The idea behind herd immunity is that you increase the number of immune people to such a high point that no matter the other variables, Rt won't surpass the magical value of 1.0.
So why is the 1.0 value so important? When Rt gets above 1.0, on average, every infected person will in infect more than one other person. We'll have exponential growth. When it is below one, we have exponential shrinkage.
Mortality numbers
So let us have a look at what would roughly be needed for #covid19 immunity levels to keep a second wave from hitting us hard. We hit a whole lot of bumps of uncertainty along the way. The first bump is that on an international level infection level numbers aren't really comparable. We have confirmed cases, but testing practices differ between countries and even within countries over time. The least unreliable numbers we have are mortality numbers.
Here also, surprisingly, the reliability differs between countries. Many countries admit to under-reporting mortality and there have already been a few countries who did major upward corrections. In my own country, The Netherlands, estimates based on all cause mortality rates are that the numbers might be of by as much as 100%, putting the Netherlands pretty close to our southern neighbor Belgium. Under-reporting seems the unintended result of a lack of testing capacity. But there are also rumors of over reporting in some third world countries. One difference thought to confirmed cases, the way mortality is counted in a country seems to be way more stable and less prone to shifting selection bias than the confirmed cases numbers. This means that while there is great uncertainty about the true number of deaths due to #covid19, there isn't so much about the relative rices and declines in mortality numbers, and these are exactly the numbers we need for our Rt numbers. For now let us start though with an assessment about the current mortality figures.
- First source of uncertainty: Based on reports and rumors on both under and over reporting of mortality numbers in different countries, it is reasonable to assume (model) a lognormal probability distribution for the accuracy of the reported mortality numbers. From the limited data available on the true size and pervasiveness of under and over estimates , we estimate our confidence interval for individual country mortality to be less than half an order of magnitude with an expected value slightly above the reported numbers.
We will revisit the mortality numbers later. Lets look at Rt. In order to understand the uncertainty regarding Rt, we must realize that mortality as function of t, M(t) not just lags infection as function of t, I(t), its is highly likely that M(t) is a stochastic transformation of I(t).
From mortality to an Rt approximation
Let start with the mortality rate for the whole globe.
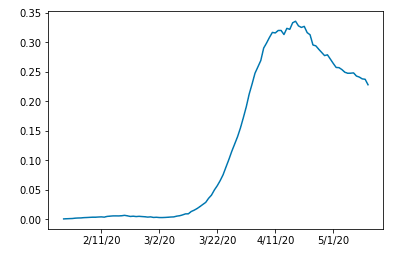
And those for the hardest hit countries:
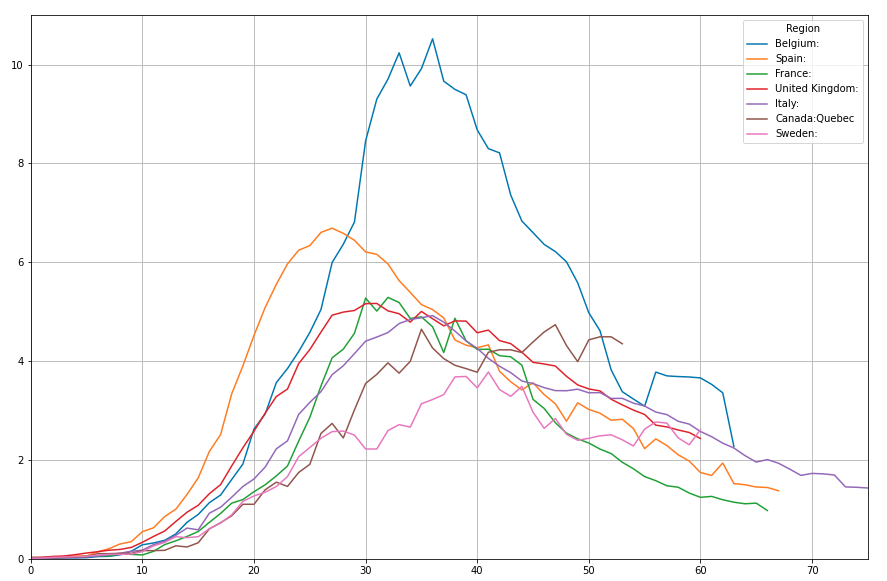
If one thing is clear it is that none of the mortality waves resemble an elegant cosine or gausian like wave form. But that is to be expected given the number of variables both affecting Rt and affecting the stochastic transformation of I(t) to M(t). To grasp a bit of the range of scenarios we may be dealing with, we must look at the two extremes.
- The strochastic transformation of I(t) -> M(t) is completely flat. Estimating Rt based on M(t) gives us a reliable result.
- I(t) is fully symetric, the difference in slope between graph on the left and and on the right side of the modus is 100% the result of the properties of the transformation of I(t) -> M(t).
It is reasonable to assume that neither of these extremes is valid and reality is somewhere in between. Small dense countries and regions show us shrinkage patterns that make it likely we are much closer to #1 for sizeable countries but possibly closer to #2 for smaller countries. As such and given the shape of the curves, it seems fair to take smaller countries as base for estimates of the accuracy of mortality based estimation of Rt. Given the stats for counties like the Netherlands and Belgium, I would make the following statement.
- Second source of uncertainty: Based on the asymmetry of the smaller country curves, we estimate the true value of Rt to be slightly underestimated on the way up the mortality rate curve and slightly overestimated on the way down the curve, based on slope based uncertainty.
In order to estimate Rt, we must have a model of the time that an average person is contagious. Again a factor of uncertainty. Estimates seem to range from 8 to 20 days. Here however we run into an interesting property of R(t). Untill we get to the subject of crushing the curve, we can just pick a number somewhere in the middle and act as if that is our number, 14 days, because the rate of change is driven by Rt to some power, so for now we just role with a nice number in the middle. We simply define a virtual Rt or Rtv as the number Rt would have if we were sure about the 14 day period of being infectious.
We need to remember though that there is a third source of uncertainty here that we'll be bumping heads with later on.
- Third source of uncertainty: The number of days someone is contagious, reports say somewhere in the range between 8 and 20 days.
So lets have a look at the world first. What does our 14 day Rtv look like for the world:
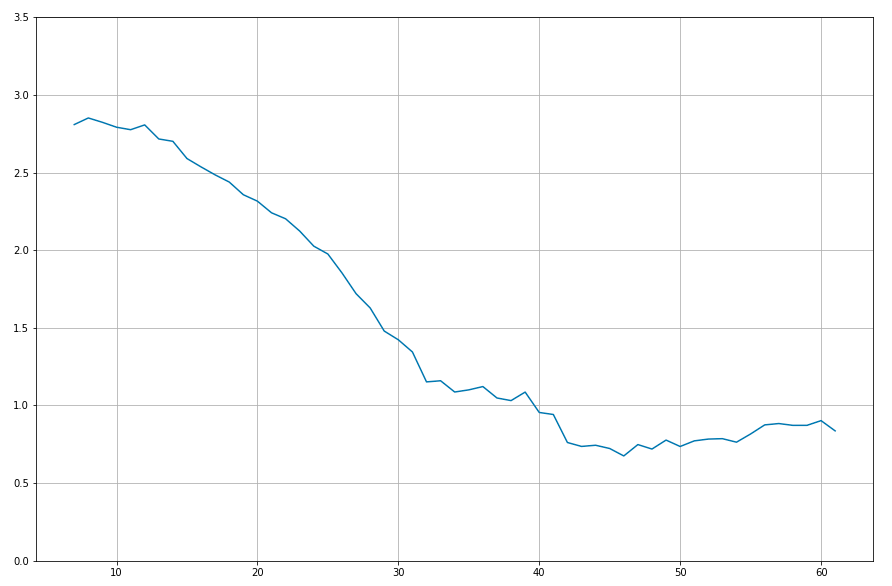
We see a peek at about 2.8 for our 14 day contagiousness assumption.
But how about individual countries, lets first look at a bit of a mess of an image to see if we can see a pattern:
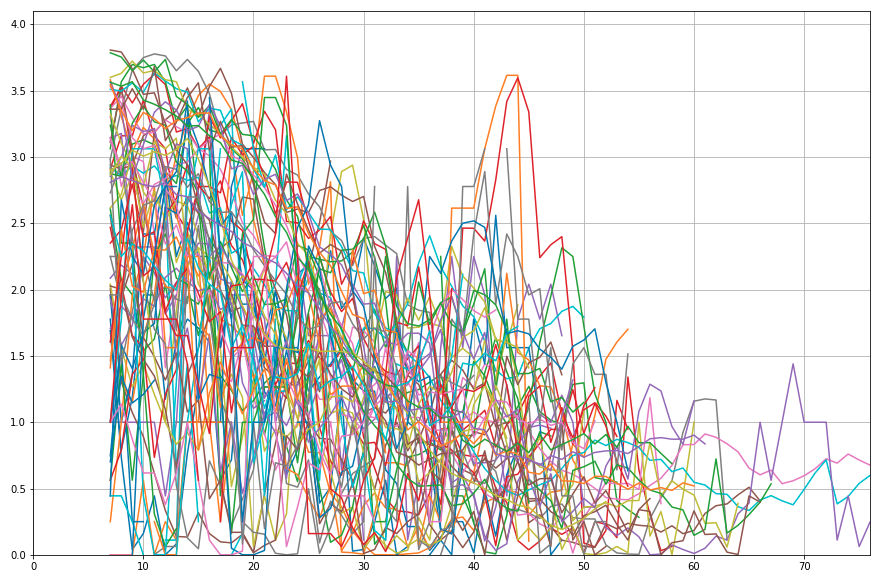
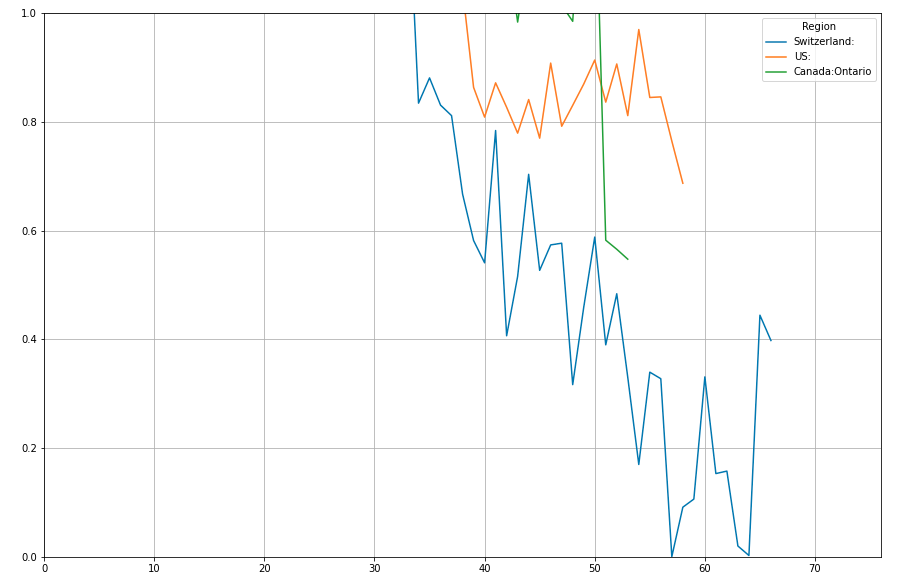
Let's look at a few of the hardest hit countries now:
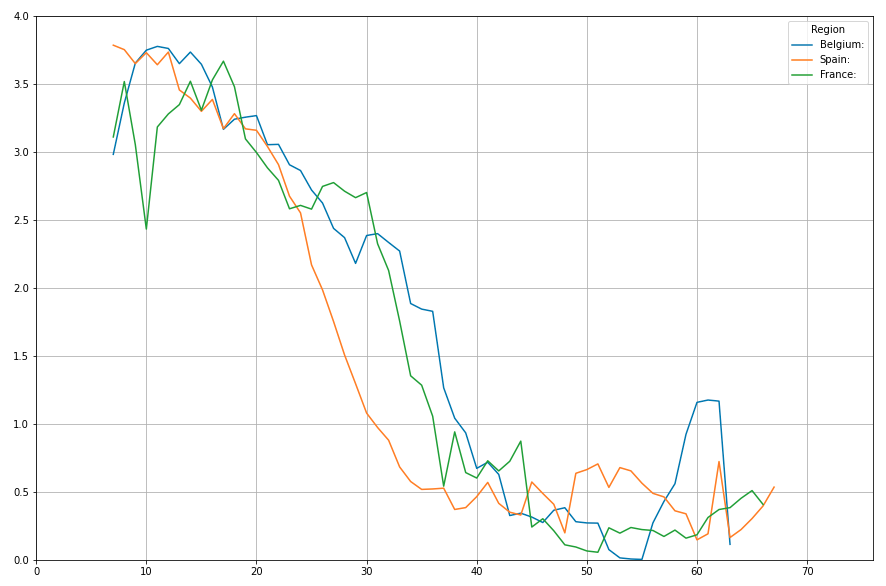
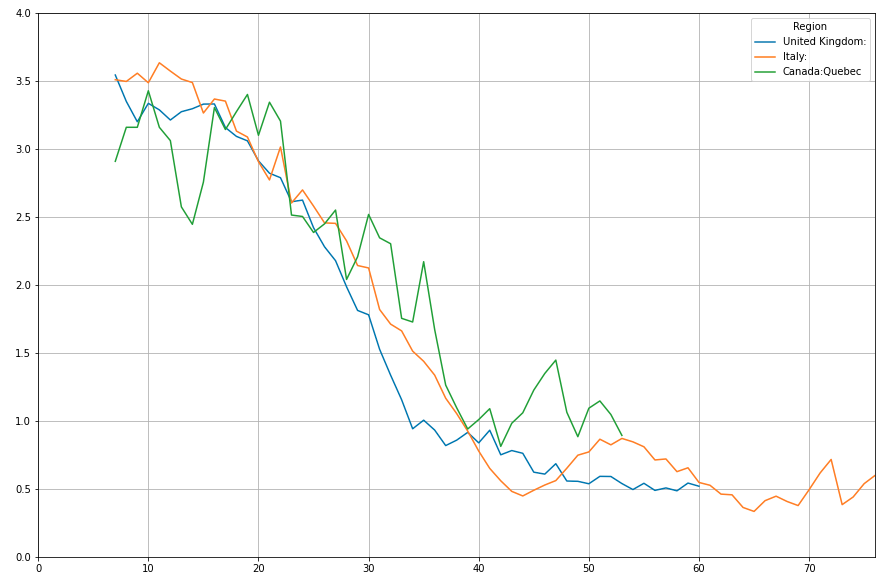
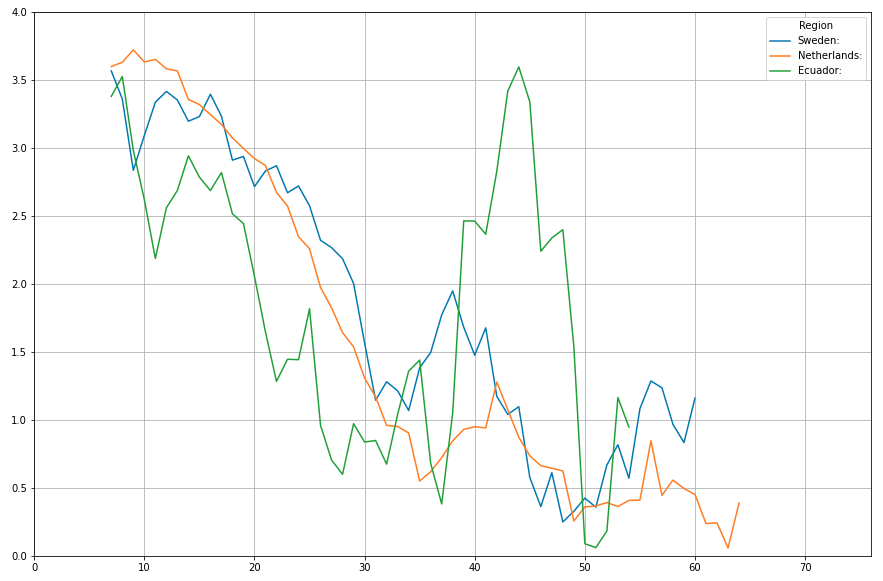
Notice the pattern? All curves start off at round and about 3.5, then drop quite quickly. Given the uncertainty we spoke of earlier, we could say an Rtv of somewhere between 3.0 and 4.0 is the number to beat.
Herd immunity
Now to herd immunity. If an Rtv of 3 ..4 is the number to beat, if this number is where we would end up if coming autumn or maybe next spring, all measures would have ended similar conditions as that created the initial massive rise would occure over again?
We need to unfold our contagiousness uncertainty now to figure that out. We need to figure out the true range for Rt.
Lets look at the extremes.
Based on this cuncertainty, we can conclude that Rt at peek has been somewhere between 2.0 and 7.0 for the hardest hit countries. So if we want to stay below an Rt of 1.0, the number we need to stay below for true herd immunity, a percentage number between 50% and 85% of the population would need to have been infected with this virus.
Some suggest that a large number of people with great health and/or great vitamin D status is intrinsically immume to this disease, so lets give this aspect the benefit of the doubt and say between 0% and 50% of people are. Then we would shift the lower bound to 25% for herd immunity.
At this moment, according to recent numbers, Belgium, the hardest hit county in the world according to the stats, measured at only 6%. Looking at the curve from belgium today, both infection and mortality curves seem to be on their way down, so Belgium is unlikely to incraese its immunity numbers very much further before fall anyway. So we would basically need Belgium to be hit by a wave like this one for 4 up to 14 times before herd immunity could reasonably be expected to have been reached.
If all these deaths would occure this year, taking into account our identified uncertainty regarding reported numbers, this would mean the anual mortality this year, and the price to be paid for herd immunity would be 15 to 200 people per 100,000 people. Or when reached on a global scale between about 1 and more than 15 million people.
The later is a truly unrealistic scenario. The former though might not be.
I think everyone gets that Belgium, or any other of the top twenty or so hardest hit countries wouldn't want to be hit by #covid19 this hard (at least) four flu-seizons in a row. So what are the alternatives?
Long term seizonal and/or targeted restrictive measures
Proponents of #herdimunity often portay the false dichotomy that it is either herd immunity or long term lockdown. It is not. Long term lockdown is most likely close to as harmfull as a herd immunity strategy.
One thing we must keep in mind is that Rt isn't a static number. It's a number that is affected by a wide range of variables. Many outside of our control, but also many within our control. One possible strategy, but a strategy that either requires faith in our ability to figure out the Rt equation for #covid19, or the ability to do year round continous random sample based testing, would be aimed at keeping Rt below the magic 1.0 value at all times.
If we manage to keep Rt below 1.0 at all times, even when for example seizonal conditions are at their worst, then mortality could be kept at minimal levels. This might seem impossible to do without seizonal lockdowns, but there are strong signs that with a more targeted and measured approach, this might be possible. If we look at SARS, an other corona virus, some papers state that more than two third of outbrake figures could be traced back to superspread events. There are many disperate data points strongly sugesting the same might be true for #covid19. Churches, prayer and singing events seem to all play a huge role in super spread events. And there are other measures that, when tuned to the seizonal waves could help keep Rt down at exactly the right moments. We'll look at a few after the next section.
Crush The Curve.
A second more aggresive possibility to adress this cisis would be closer to a sustained lockdown, but still could most likely be done smarter than a full on lockdown. Exponential shrinkage, what happens whenever Rt is below one, can shrink the amount of infected individuals quite rapidly.
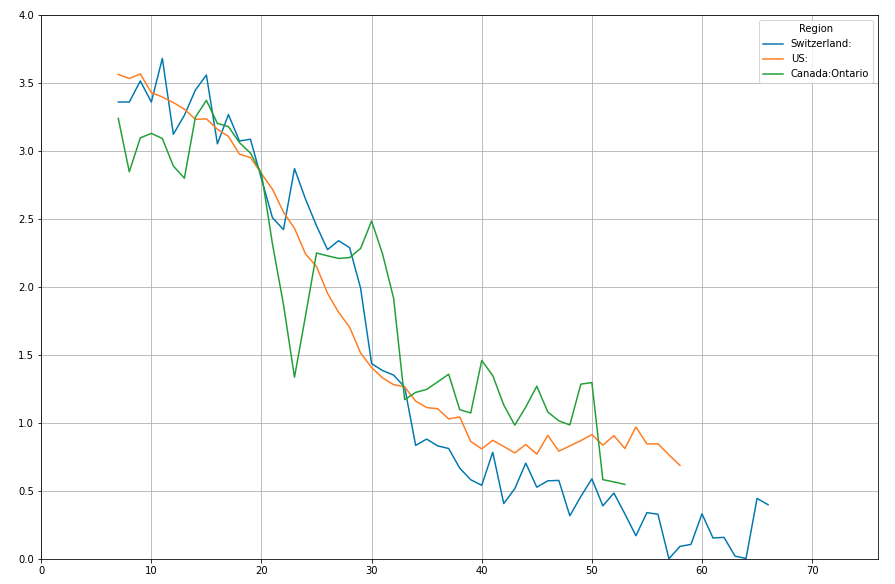
Have a look at Switserland
If a region manages to keep Rtv below 0.5 for two weeks, the number of infections will drop by 50% in those two weeks. 0.25, and it will halve in just one week. If instead of losening up when due to seizonal aspects Rt is alreaddy naturally low, we'dd double up on smart measures exactly at that optimum time, it might be possible to have enough halvings to completely irradicate the virus, at least locally. A crushing the curve pollicy like this however has a huge drawback. Its just like wearing a mask. It only works if enough do it. If most countries implement a Crush The Curve strategy, closing the borders to countries that don't after N halvings could be a viable option.
For a global scale crush the curve strategy we would currently need to realize somewhere between 20 and 25 halvings before we can expect a 14 day period where none of the remaining contagious people would infect a new person.
Smart measures?
When we look at the infection data from marine ships, cruise ships, identified super spreader events and identified super spreading locations, and if we also look at research done for SARS in the past, it becomes truly unlikely that hand to face transmission is the only or even the prime spreading factor for #covid19, or that through the air transmission is limited to 1.5 meters in all conditions. The role of humidity in seizonal and climatological aspects of hot zones, sick building scenarios, etc, make the hypothesis that #covid19 is in fact airborn beyond the droplets scenario that the masks dont work narrative and the 1.5 meter measures are based around, a viable hypothesis. I am no virus expert, but from my knowledge of airflow dynamics and general data engineering, I find both the droplets model of spread and the hands only spread model highly unlikely given the amount of major data point pointing to airborn spread. Given this I think none of the above two masks, building and event humidity control and air flow management should be considered as potential major factors in either crushing the curve or doing some kind of controled seizonal measures to keep Rt below one.
But wether we as a planet choose to crush the curve or not, neither a continued dumb lockdown nor a misguided attempt at herd immunity should be taken into serious consideration anymore at this point in time. We didn't have data to dismiss either a month ago. Now though, with every passing day it becomes more and more clear that neither a continued dumb lockdown nor a continued target of herd immunity has any thread of sanity as a way forward.
With masks, inside air treatment, and acting un the assumption that inside, under low airflow or high air recycling low humidity conditions the virus is somehow airborne beyond the currently projected 1.5 meters, I believe, based on the data, we should have a good chance at crushing the curve. Possibly, in many regions without maintaining full lockdown.
Maybe we fail at completely crushing the curve before autumn, but if super spreading events can be avoided, potential super spreading locations can remain closed, and if we test test and test, we could still avoid a second wave this autumn, likely without a second full lockdown, and we can buy ourselves the time to crush the curve before spring next year.
For those who wonder why I'm not discussing vaccines. I'm all for embracing uncertainty, but when looking at vaccines for #covid19, next to the fact that its really outside of my dat modeling and engineering set of skills to evaluate anything factoring in a non existent vaccine, there really is a limit to the possibilities of modeling uncertainty. I draw the line at trying to factor in non existant vaccines or the second comming of christ when moddeling uncertainty.
Stay safe
I would like to add a couple of comments here.
A first question I always ask is the following: is herd immunity achievable at all? Where are the proofs that someone infected will be safe from being re-infected later? I have not seen anything with this respect (maybe we will just have to live with the virus and that’s it). Therefore, it is important to keep in mind that herd immunity may never be reached. This being said, I am not an epidemiologist. So feel free to redirect me to anything that I could read to be better informed.
Also, another remark concerning the lock-down: the only motivation behind it, still according to my own personal opinion, is related to the capacity of the hospitals. The two ways to prevent the ICU units from being overwhelmed are either to limit he incoming flux, or raise the bar. Lock-downs address the former (and this is why they have been put in place) and bad health politics have made the bar so low today (and this does not seem to change unfortunately).
Very nice post my the way!
Great writing. Thanks!
Beautifully written and well discussed. Do you mind putting a list of the resources consulted while making this article? I would be interested in some. Thanks
Updated my post with a number of links to papers and a link to the global-data dataset.
Thanks for your contribution to the STEMsocial community. Feel free to join us on discord to get to know the rest of us!
Please consider supporting our funding proposal, approving our witness (@stem.witness) or delegating to the @steemstem account (for some ROI).
Please consider using the STEMsocial app app and including @stemsocial as a beneficiary to get a stronger support.
Congratulations @pibara! You have completed the following achievement on the Hive blockchain and have been rewarded with new badge(s) :
You can view your badges on your board and compare to others on the Ranking
If you no longer want to receive notifications, reply to this comment with the word
STOPDo not miss the last post from @hivebuzz: