My fellow Hivers,
Stock prices have risen sharply in recent weeks. According to various analysts, the Bear Market is already behind us and investors may look forward to further rising stock prices. An important indicator, on the other hand, shows that investors should take a stock market correction into account.
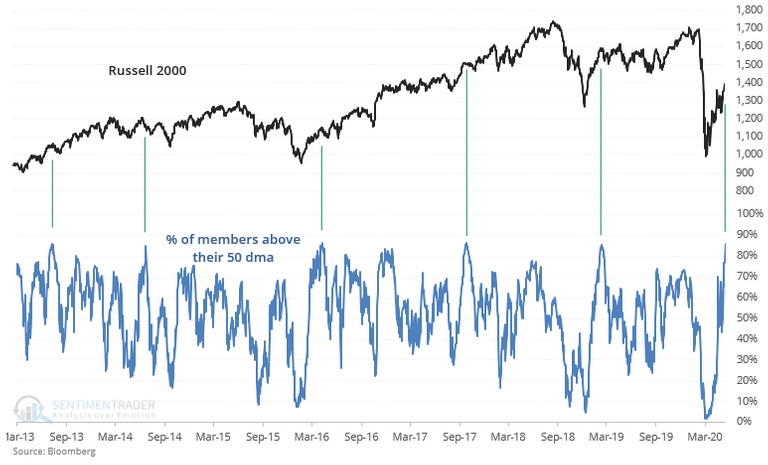
The chart above shows the price chart at the Russell 2000 index. This index consists of 2,000 US small-cap stocks. An important indicator is shown at the bottom of the graph. This indicator shows the percentage of the shares within this index that move above the 50-day average. Yesterday, that percentage rose to 85%.
This seems to be very beneficial, but it certainly is not. After all, this percentage indicates that the market is quite 'over-bought'. In recent years, such a high percentage has always led to a stock market correction in the two months that followed. So we have been warned.
Thank you for reading!
https://slimbeleggen.com/trends/deze-indicator-waarschuwt-voor-een-beurscorrectie/
Lots of contrasting indicators out there.
What will it look like in a month or two. It is anyone's guess.
For now, the market seems to want to run. The bulls are in control.
Posted Using LeoFinance
Indeed very conflicting information out there. My educated guess is to the downside ... But with these markets, who knows ....
I am nimble right now because, I agree, looks like more room to the downside than up.
Nevertheless, the markets can keep defying odds.
Posted Using LeoFinance
I have a few hedges in place, just in case ;-)
Very good summary !! How did you discover that indicator works the same way when used in btc?