Introduction:
I've often considered starting a kick-starter project for one of the many business ideas I've had. But I've never actually gone through with the process before, like many of you. But earlier today I was browsing kaggle looking through some of their datasets and I came across a kick starter dataset. I decided to explore it a little bit.
I wanted to see how the distribution by country broke down and how things broke down by category as well. I threw it into powerbi to just take a little bit of a look tonight. I might consider loading up R and taking a more in-depth look later.
Distribution by country
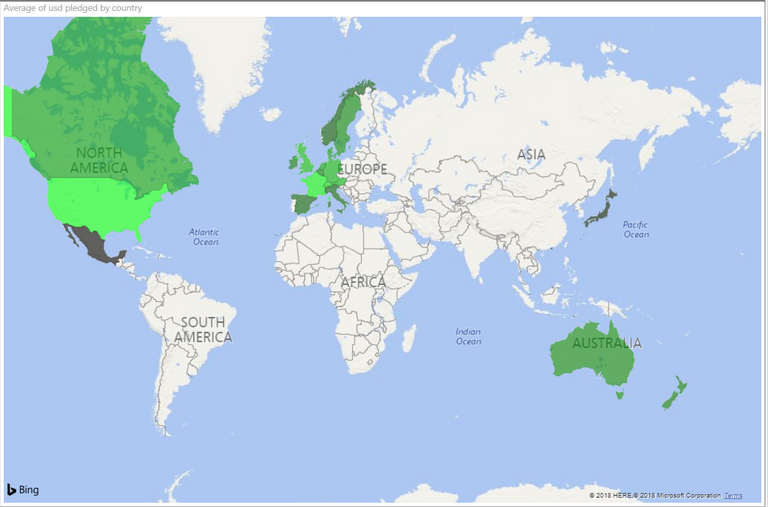
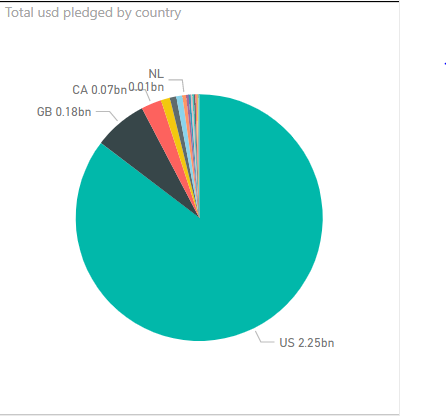
I decided to first look at USD dollar amounts and see how it breaks down. I discovered that the US pledges far more in terms of absolute numbers than any other country. So I decided for a more interesting comparison I'd look at the average per country. The greener the country, the higher average pledge amount, black countries have smaller amounts.
Average usd pledged by country
Total usd pledged by country
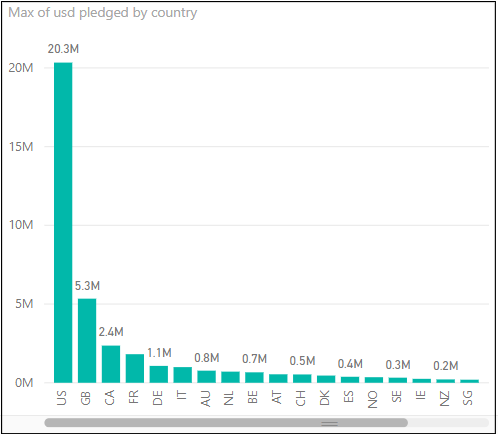
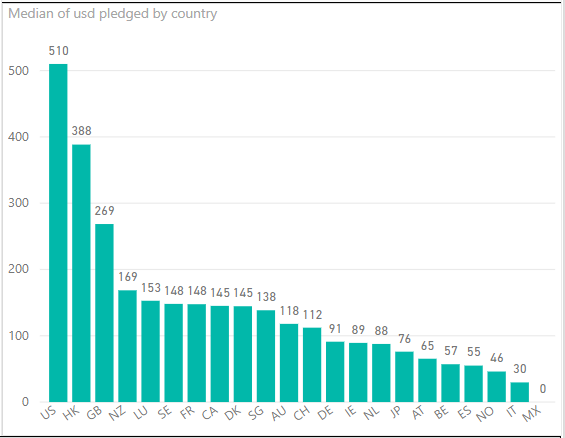
Then I looked at the Average, Max, and Medium amounts pledged by country.
Max
Average
Medium
I decided against showing the minimum because... well it was tiny, a few cents.
Duration
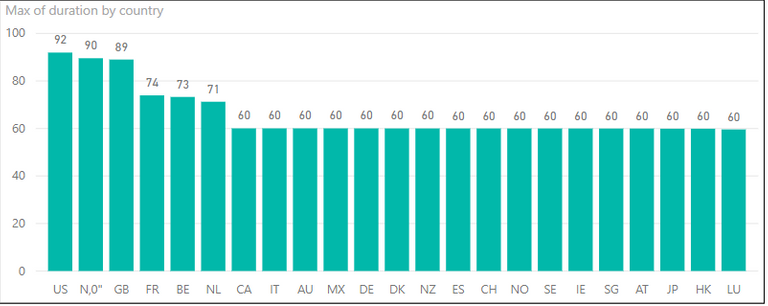
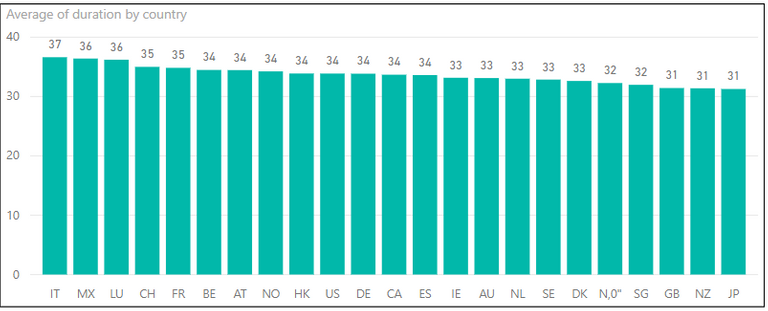
Then I looked at the duration of the kick starter campaigns to see which country has the longest contribution periods. I consistently found this odd country called "N,0"" in the dataset. But it's apparently, a real place, not a country, or even a land mass. But a small bouy off the coast of Africa. Further, when when doing the max duration by country I found that the US had somewhere near 2,000 plus days for it's max duration, while the other countries had near 90. I found that within the dataset there were canceled projects which weren't ended after they got canceled, so they had no pledges but just racked up tons of days. I decided to prune that data out because it was an outlier. This shows the importance of cleaning your dataset before you analyze it.
Max duration by country
Average duration by country
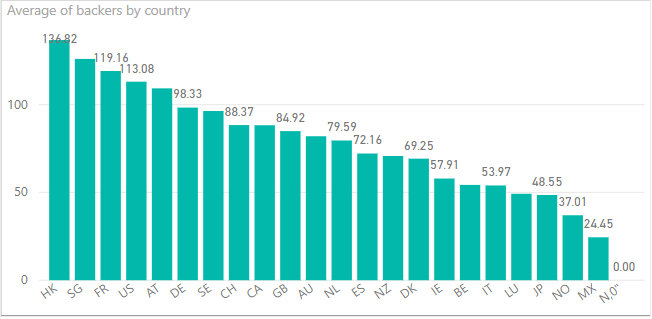
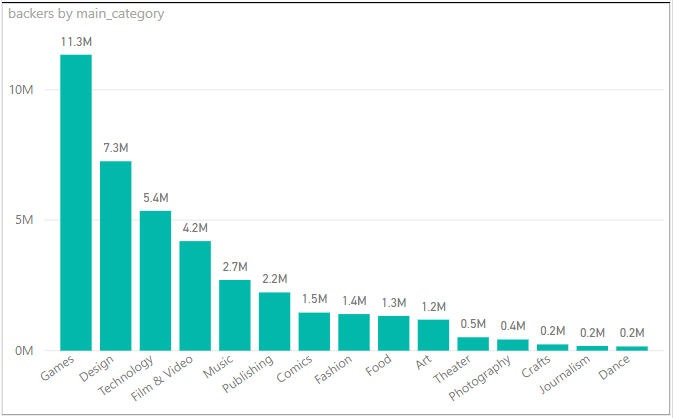
Then finally I looked at amount of backers and how the cateogries broke down
Average backers by country
Backers by category
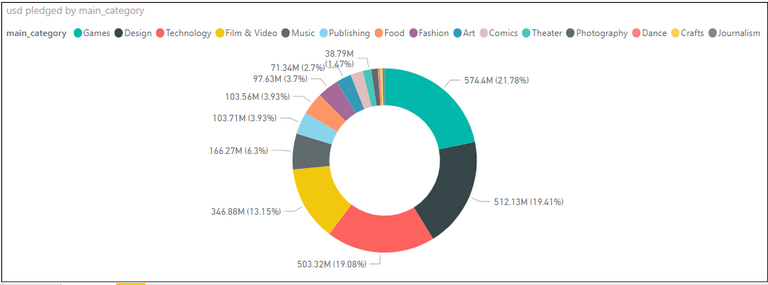
Pledged by main category
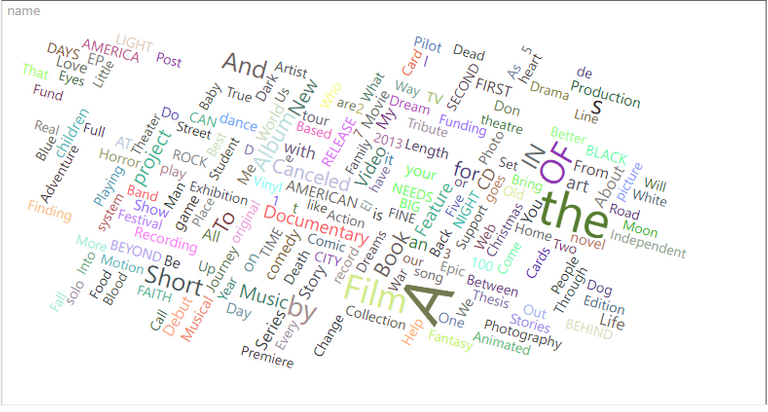
A word cloud of the names used by the projects
Conclusion
Seems like if you want the best chance of getting a funded project, it had better be a game, a technology, or a film/video. As those categories have both the biggest number of backers and largest donations. Just a few thoughts to consider on your way to crowd funding a new business idea!
Updates on klabboy:
If you liked this consider following me, dropping a like/reblogging, and leaving a comment. My account has been inactive recently but I have more free time and I will be posting more things like this. If you have any suggests on something I should do next, I'm always open to ideas!
So if you like data, politics, economics, and the occasional cryptocurrency post. Give me a follow! Thanks and I hope you enjoyed.

Congratulations @klabboy! You have completed the following achievement on Steemit and have been rewarded with new badge(s) :
Click on the badge to view your Board of Honor.
If you no longer want to receive notifications, reply to this comment with the word
STOPTo support your work, I also upvoted your post!