Any research is made up of a broad question and sub-questions. We use various techniques to answer the questions we ask. In this series the lab notebook I am going to describe the nuts and bolts of techniques I use on a regular basis. Majorly, because the details behind the technique are hard to find or at least hard to find in one place. And also because these are common questions I get from colleagues, so I thought why not catalogue it as a blog.
Adapted from scale by Clker-Free-Vector-Images | Pixabay and Transcription by National Human Genome Research Institute | Public domain
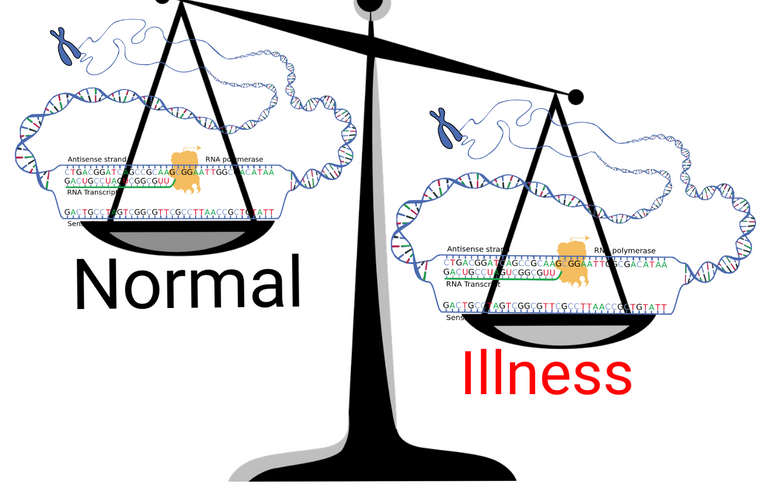
A brief insight into gene expression.
Any biological system is made up of DNA. DNA is what carries the genetic information of an organism. Protein machines (RNA polymerases) in our cells read the DNA sequence of the gene and makes a messenger RNA (mRNA). This mRNA goes to ribosomes in the cells which reads it's sequence and makes more protein machines based on the sequence of mRNA. These machines then carry out all functions of living cells - from their structure to transport of molecules, copying of DNA and reading DNA to make RNA - its all done by these protein machines.
When we talk of genetic differences between people, we look at the sequence of their DNA. Yeah, people can carry a different version of the same gene with slight mutation here and there. This slight difference can affect how efficiently the protein machine the gene encodes would work. But, apart from the efficiency and performance of the machine, there is another aspect. How many machines are there in a cell or tissue to perform a certain function. The number of machines that would be made can be regulated by the gene expression level or how many copies of mRNA are made by the cells (see my previous blog). Today's post is about a technique used to quantify the amount of mRNA present in a cell or tissue. The technique is known as quantitative PCR or qPCR or real-time PCR.
What is qPCR
Well, what even is a PCR, to begin with?
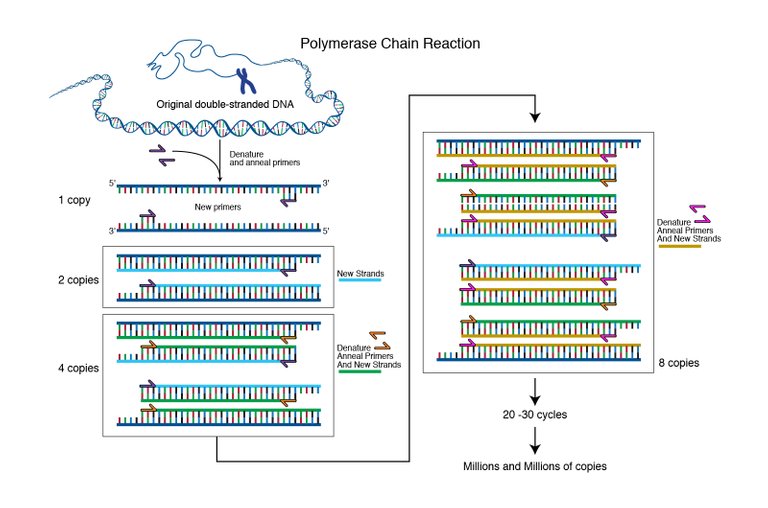
Image from genome.gov, Courtesy: National Human Genome Research Institute | Public Domain.
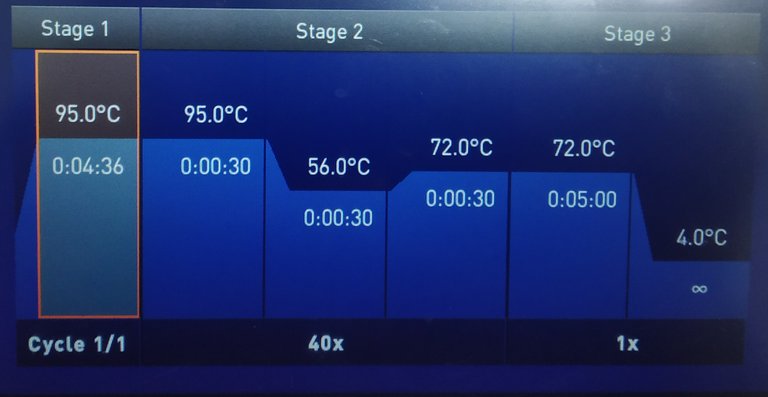
Image by @scienceblocks
qPCR can be thought of as an add on to normal Polymerase chain reaction (PCR). The PCR is a technique to amplify a region of DNA by using a DNA polymerase enzyme. So how do you amplify DNA? Well, you make primers that would enclose the region of DNA you want to amplify. You first open the DNA strand by heating it up to 95 degrees. Then, you decrease the temperature to 50-60 degrees depending on the optimal binding temperature of your primers. After the primers are bound they have to be extended to copy the gene. Hence, you increase the temperature to 72 degrees at which the DNA polymerase works most efficiently. The DNA polymerase will use the nucleotides in your reaction mix to extend the primers and hence make a copy of the gene. And then the cycle begins again from the 95 degrees melting of DNA strands. (Here is a cool animation explaining the PCR.)
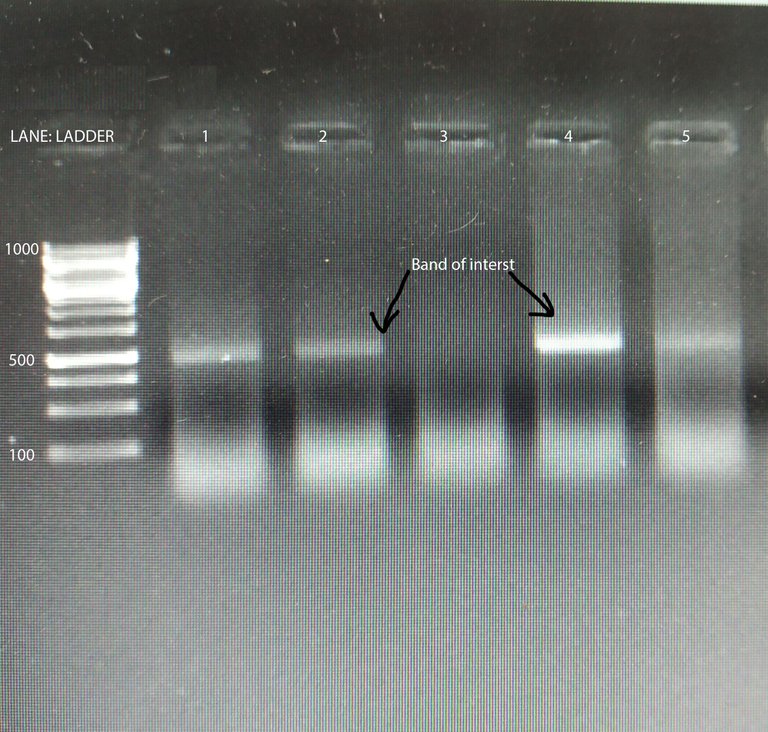
Image by @scienceblocks
Hence, if you started with one copy of the gene in one reaction, after 1 cycle you will get 2 copies. After 2 cycles you will have 4, and 3 cycles you will have 8 copies of the gene you intend to amplify.
If N0 is the initial copy number of sequence you intended to amplify, then final copy number Nc, after c cycles would be -
Nc = N0*2c
So, if you started with 1 copy of your gene, after 30 cycles, you will get 230 or approx 109 copies of your gene. What this does is that it makes enough copies of your gene, for you to be able to visualize it in an agarose gel post electrophoresis. But, since it follows a mathematical equation it also gives you an opportunity for comparing the gene expression between two different cell types or same even the same cell type in different conditions. And, if you want you can even do absolute quantification.
Quantifying the gene expression from Gel Image.
Semi-quantitative PCR
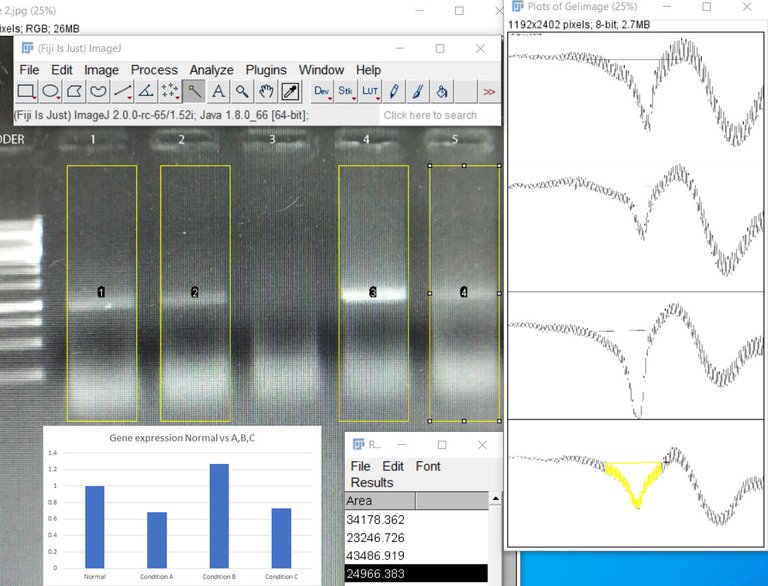
Image by @scienceblocks
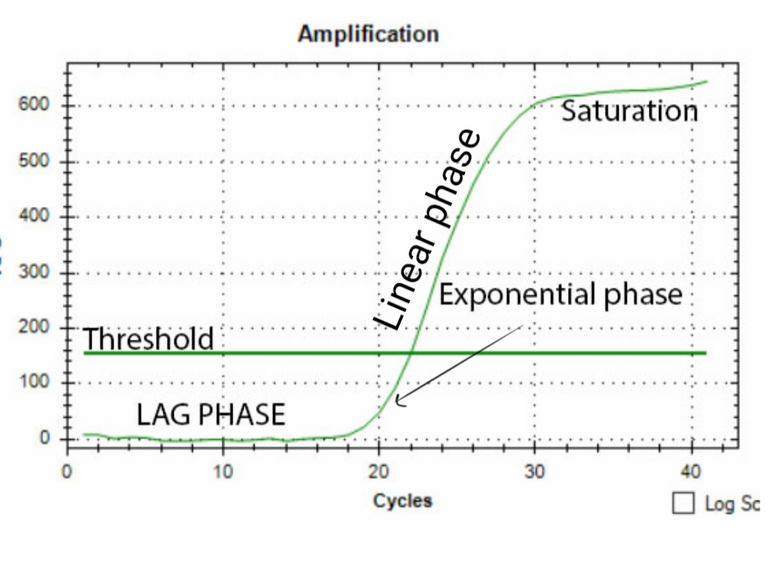
One way to do the quantification would be to measure the band density in the gel. If you loaded the same amount of DNA obtained from two different conditions in the two reactions, you can find the relative difference as band density of test condition/band density of control condition. However, this method has a limitation. For instance, if your bands are too saturated it would mask the difference. Also, the way the DNA is amplified has its own curve. As you would see in the figure below, there is a lag phase, followed by an exponential phase, followed by the linear phase, which is then followed by a saturation phase. For your quantification to be precise you need to know at what cycle number is your reaction in the linear phase. So the best you can do with your band density is to say whether in some condition your gene is expressed more or less. That too if you have not overdone the reaction or have saturated bands. Also, what you can't say for sure is how much more or how much less. To do so you need to observe the amplification of your gene in realtime. This is where qPCR comes in.
The quantitative PCR (qPCR)
The basic idea is to have a fluorescent dye which would fluoresce more and more as the amplification proceeds. The fluorescence should be directly proportional to the number of amplicons made. There are two ways to do it. One is to have a fluorescent dye and it's quencher bound to a probe (Taqman probe) which would bind in middle of the sequence which the primers will amplify. When the DNA polymerase would amplify this region the probe will be digested, the fluorescent dye will be released and you can measure the amount of fluorescent in your reaction in realtime. Another method is to have a dye such as SYBR green which gets incorporated in the double stranded form of DNA. The more the dye is bound, the higher is the fluorescence reading (see this for more).
What you get at the end of your qPCR reaction is the amount of fluorescence at each cycle of reaction. Once you have the plot for all the gene amplification in different conditions, you can set a threshold on fluorescence somewhere in the linear phase and ask - what was the cycle for that gene in a given condition when the fluorescence had this threshold value?
If you use above equation,
Nct = N0*2ct
where ct is cycle number at threshold.
Then cycle number would represent
ct = Log2(Nct/N0)
Or,
ct = Log2(Nct) - Log2(N0)
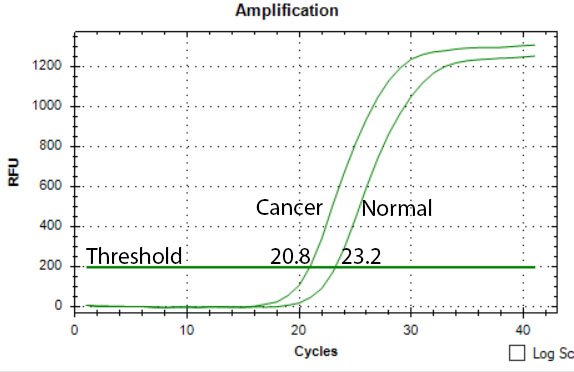
Image by @scienceblocks
Take an example where you were measuring the expression of some gene X in normal vs cancer patients. What you need in this case is -
N0(X in Cancer)/N0(X in normal)
Or in log scale,
Log2(N0(X in Cancer)) - Log2(N0(X in normal))
Which is
ct(X in normal) - ct(X in cancer) = [Log2(Nct(X in cancer)) - Log2(N0(X in cancer)] - [Log2(Nct(X in normal)) - Log2(N0(X in normal)]
Since,
Log2(Nct(X in cancer)) = Log2(Nct(X in normal))
for same ct value,
We get
ct(X in normal) - ct(X in cancer) = Log2(N0(X in cancer) - Log2(N0(X in normal) = Log2(N0(X in cancer)/N0(X in normal))
Or in linear scale,
N0(X in cancer)/N0(X in normal) = 2ct(X in normal) - ct(X in cancer)
But there is a catch. How do you know that both the reactions had the same amount of cDNA, to begin with? You need a way to normalize everything to loading. You can do this by using a housekeeping gene. Housekeeping genes are the genes which are expressed at high levels in all cells. These are the genes essential for survival, so you would also expect them to be expressed at same levels (though pick your housekeeping gene with caution as this assumption may not always hold true). The examples would be beta-actin (gene for a cytoskeletal protein), GAPDH (important for energy metabolism) or 16s rRNA (makes RNA which ribosomes crucial for ribosomes). So how do you normalize? What you need in this case is -
(N0(X in cancer)/N0(H in cancer))/N0(X in normal)/N0(H in normal)
Where H is a house keeping gene.
So how do you get that?
We will calculate delta ct normalised to housekeeping as
Δct(cancer) = ct(H in cancer) - ct(X in cancer) = [Log2(Nct(H in cancer)) - Log2(N0(H in cancer))] - [Log2(Nct(X in cancer)) - Log2(N0(X in cancer))]
Since, Log2(Nct(H in cancer)) = Log2(Nct(X in cancer)), for a same threshold fluorescent value, we get -
Δct(cancer) = Log2(N0(X in cancer)) - Log2(N0(H in cancer))
Similarly,
Δct(normal) = Log2(N0(X in normal)) - Log2(N0(H in normal))
Now, to calculate the relative expression of X in cancer vs normal tissue, we will calculate delta-delta ct
ΔΔct = Δct(cancer)-Δct(normal) = [Log2(N0(X in cancer)) - Log2(N0(H in cancer))] - [Log2(N0(X in normal)) - Log2(N0(H in norm))]
Or,
ΔΔct = [Log2(N0(X in cancer)/(N0(H in cancer))]/[(N0(X in normal)/(N0(H in normal))]
Hence,
(N0(X in cancer)/N0(H in cancer))/N0(X in normal)/N0(H in normal) = 2ΔΔct is how much more or less the gene X is expressed in cancer.
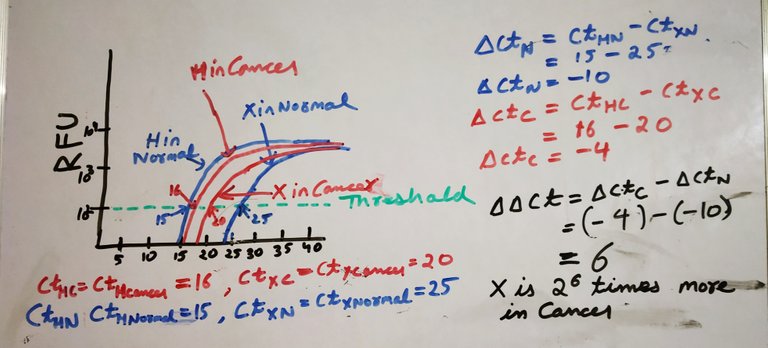
Drawn on the whiteboard by @scienceblocks
Basic workflow
Drawn by @scienceblocks
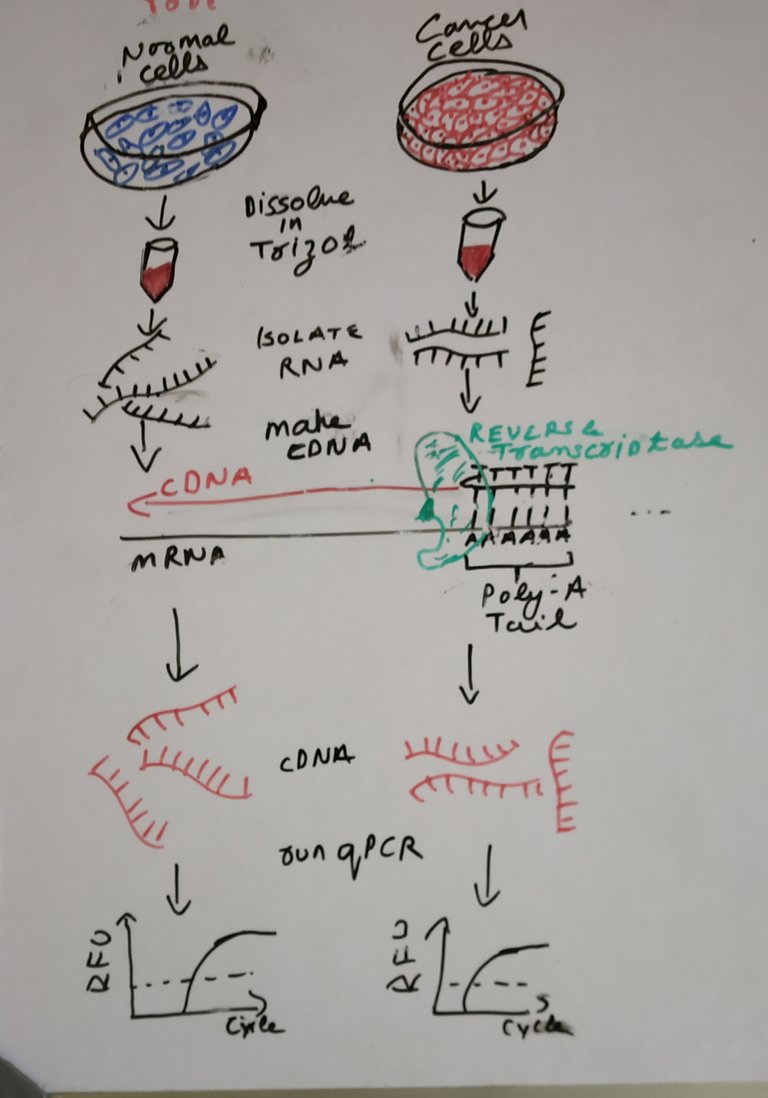
Now, that we are clear with what we would be measuring, comes the question of how from tissue or cells we reach to this point.
If you were using cells the idea is pretty simple. You put trizol (a chemical solution) over your cells and proceed with RNA purification. If you were using a tissue, there would be an additional step for lysing your tissue with a method of your choice. The lysed tissue is again dissolved in trizol and proceed with RNA extraction.
Note that some people may use other RNA extraction kits such as RNAeasy instead of trizol.
Once, we have RNA the next step is to convert your mRNA into complementary or cDNA. This is achieved by a reverse transcriptase reaction. Since mRNA has a polyA tail, a polyT primer aka oligo dT - TTTTTTTTTTTTTTTTTTTTTTN (N is A or T or G or C) can be used to specifically copy mRNA into cDNA. Alternatively, you can also choose random hexamers to make cDNA. Random hexamers are made of 6 random nucleotides. This will bind to random regions in your mRNA. The benefit of random hexamer is that you can make cDNA from mRNA which doesn't have polyA tail.
Once we have the cDNA we are ready to set up the qPCR reaction. All you need to do now is mix SYBR green, DNA polymerase, water, nucleotide cocktail (A, T, G, C) primers, and cDNA together and load it in a qPCR plate. Load the plate in the qPCR machine, set the program and you are good to go. The machine will give you ct values for each reaction and you can calculate the gene expression using equations explained above.
qPCR primers - designing and validation
The second major question I mostly get is how to design and validate the primers.
The designing
Before you think of designing the primers, it's a good idea to look in a primer database - primer bank, which is a public database for. Harvard, specifically for qPCR primers. The good part is that sometimes if you are lucky, you may even find pre-validated primers. Another way to to go about this is to look at published papers who might have already done the gene expression analysis of gene of your interest.
However, if you do not get the primers for your gene anywhere, or if you want to design them from scratch a good option is a program called the primer blast. All you need to do there is enter the details of your gene - either it's GenBank ID or its sequence. Set the max product size to 200, as it is optimal for qPCR reaction times we use. In exon junction span choose that primers must span exon-exon junction (or you can just provide the gene sequence without introns). This would make sure that you only get signal from you cDNA in reaction and don't get any false signals from genomic signals contamination in your prep. The program will give you the most optimal primer pairs. Pick the ones which has least amount of self complementarity and annealing temperature of about 60 degrees C. Choosing the 60 degrees temperature for all your primer pairs for different genes is good because - you can run all the reactions together and a lot of qPCR enzymes available in market are capable of doing annealing and extension step at 60 degrees.
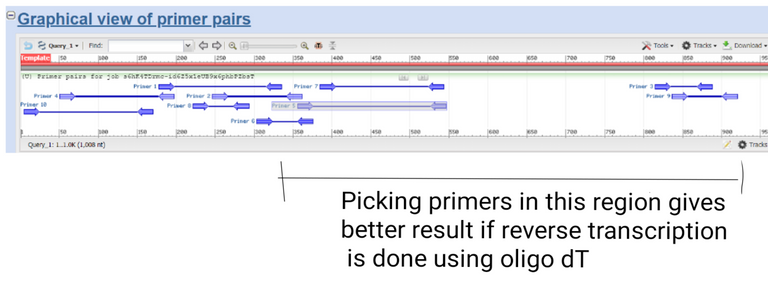
Results created by using primer blast by @scienceblocks
Now, if you were using oligo dT for your reverse transcriptase reaction it's best to choose primers near 3' end of your gene. Especially if your gene is too long. This is because the efficiency of reverse transcriptase is good only up to say 800-1000 bases. If you were using random hexamers, on the other hand, it doesn't really matter where in gene you pick the primers.
Even primers seek validation from you
Irrespective of whether you get your primer pairs from a database or publication, or you make them, it's always a good idea to validate them. What validation means is that you test the primers for their efficiency. If you want your data to be of good quality, your primers should have maximum efficiency.
Plotted on excel by @scienceblocks
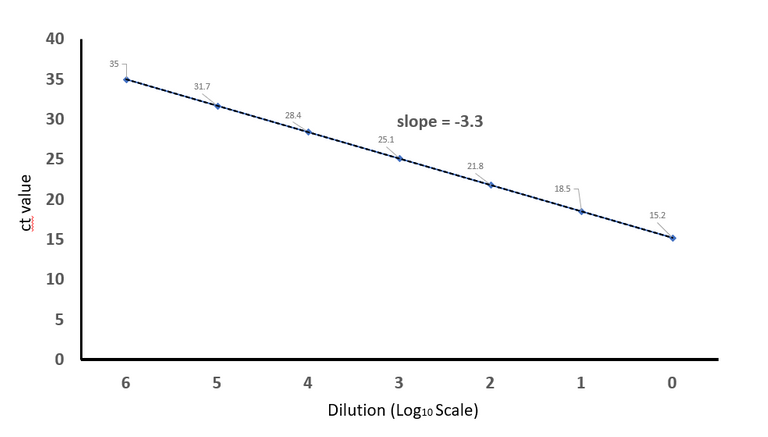
The ideal situation would be to have 1 ct decrease for every 2 fold increase in the concentration of your cDNA, and 3.3 ct decrease for every 10 fold increase (because Log210 = 3.3). So say you loaded 1 nanogram (ng) of cDNA for testing GAPDH primers and got a ct value of 30. Now if you load 10ng cDNA you should get a ct value of 26.7. If you loaded 100ng cDNA you should get ct value of 23.4 and so on.
Usually, we are unsure of cDNA concentration after reverse transcriptase reaction. But it is likely to be in proportional to the amount of RNA you used. So whatever cDNA we get we serially dilute it in water. So every dilution is 10 times more dilute than your previous dilution. And then, you set up the qPCR reactions.
You make a plot starting with highest ct value that you get for maximum dilution to no dilution at all. And then you calculate the slope of the line. If everything is ideal your slope should be close to -3.3
You can now calculate the efficiency by using the formula
E = (10-1/s - 1)100
For slope of -3.3 this value comes out to be -
(10-1/(-3.3) - 1)100 = 100%
But life is not ideal. And you may not get 100% efficiency always. Nevertheless, the efficiency should be greater than 90% at least for you to be able to use the primers. Sometimes, you may even get efficiency > 100%. The reason behind this you might have some DNA polymerase inhibitors in your cDNA (see this post for details). You can resolve this by either better purification of your RNA or by using more diluted cDNA.
Why is this efficiency important you ask?
Plotted in excel by @scienceblocks.
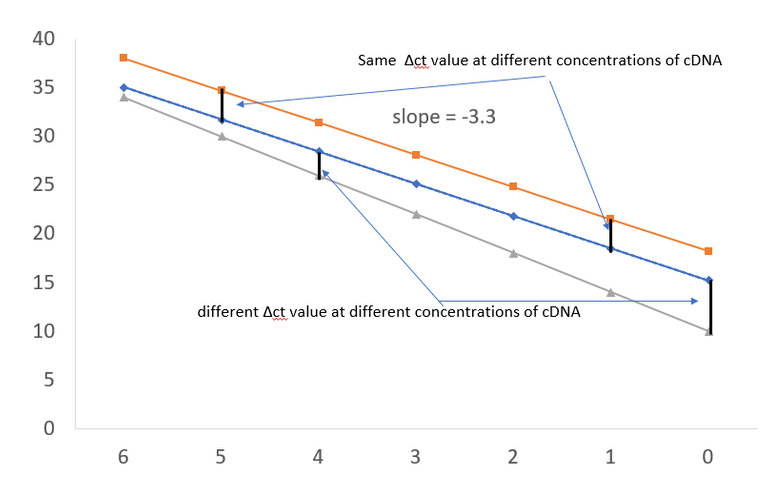
Well, the answer to that is that if you are comparing expression if two genes or two conditions, and if the efficiency of one of your primer set is less than 100% then their ct values won't be comparable. As you can see in the plots that if the line for primers for housekeeping gene and gene of your interest are not parallel then the Δct values will be off. This means that even your ΔΔct values can't be trusted.
Tip: Since you may not always get the ideal slope of -3.3, but say you E = 98% in one case and 97% in another. This problem with Δct values may still haunt you. Hence for best results, you may want to dilute your cDNA from different conditions in a way that you always get ct values for the housekeeping gene in the same range. That means if your ct for GAPDH in normal cells was 16 and in cancer cells, it was 20, you may want to dilute the cDNA of normal cells by 16 times. This would ensure that both cDNA samples have the same ct value of 20+/-1.
I think now you are ready to set up a qPCR and compare the gene expression levels. However, there is another major part of this. The statistical analysis, to figure out whether the fold changes you see are significant or not. But that would be an entirely new post. I think we already have too much information on our hand for today.
However, before I write that post do let me know what you think about the idea of talking about the research techniques on steem. Do leave your questions and suggestions in the comments.
Even though I wrote this post from experience, I do realize that some 5 years ago I had to read up a lot of material to learn this. I can't recall what I read back then, but I will cite some references below which would help you in further reading.
About steemstem
But, before I go I would like to mention about the steemstem platform. Well, if you love reading and writing interesting science articles @steemstem is a community on steem that support authors and content creators in the STEM field. If you wish to support steemstem do see the links below.
You can vote for steemstem witness here -Quick link for voting for the SteemSTEM Witness(@stem.witness)

Quick delegation links for @steemstem
50SP | 100SP | 500SP | 1000SP | 5000SP | 10000SP
Delegating to @steemstem gives an ROI of 65% of the curation rewards.
Also, if you have any questions regarding steemstem, do join the steemstem discord server.
You can DM me on discord, I have the same handle - @scienceblocks. Also if you are not a steem user, and reading this blog inspired you to start your science blog, find me on discord and let me know about you. I can try and help you navigate your way through steem.

References and further reading
How unique are you? The science of individual differences.
TaqMan vs. SYBR Chemistry for Real-Time PCR
Well, yes, much of this is beyond me and suited for someone who works in a research/laboratory setting. Still, a reading of your blog allows me to, in a sense "look behind the curtain", to get an idea of what is entailed when we submit tissue for lab analysis. I can think of a number of times when I've had lab tests done and the doctor has dismissed the results as unlikely, or unreliable. And sometimes, the report comes back and declares that the original sample, submitted for testing, was somehow unreliable.
With all the variables you describe in technique/procedure, I can see why this unreliability may exist.
I admire your knowledge :)
Thanks for reading this. Even though the idea behind this post was to make a repository of research techniques on the blog, I really appreciate that you read it. Also, I am amazed that you were able to relate it to something useful from day to day life. I really admire your ability to link science with life experiences. I think very few people can do that. It's always motivating to see a comment from you.
:)
Posted using Partiko Android
Thank you! There comes through in your blogs the desire to communicate, to be of service somehow. This is an irresistible invitation to read. 🌟 So I try, and always learn something.
Pretty nice again!
Resteem!
qPCR rox (even w/o rox).
;-)
Fantastic thank you for this... I love reading this content :)
You have put in lot of effort. Good job :)
@tipu curate
Upvoted 👌 (Mana: 5/15 - need recharge?)
Hello,
Your post has been manually curated by a @stem.curate curator.
We are dedicated to supporting great content, like yours on the STEMGeeks tribe.
Please join us on discord.
Hi @scienceblocks!
Your post was upvoted by @steem-ua, new Steem dApp, using UserAuthority for algorithmic post curation!
Your UA account score is currently 3.720 which ranks you at #5561 across all Steem accounts.
Your rank has not changed in the last three days.
In our last Algorithmic Curation Round, consisting of 101 contributions, your post is ranked at #66.
Evaluation of your UA score:
Feel free to join our @steem-ua Discord server
This post has been voted on by the SteemSTEM curation team and voting trail. It is elligible for support from @curie and @minnowbooster.
If you appreciate the work we are doing, then consider supporting our witness @stem.witness. Additional witness support to the curie witness would be appreciated as well.
For additional information please join us on the SteemSTEM discord and to get to know the rest of the community!
Thanks for having used the steemstem.io app and included @steemstem in the list of beneficiaries of this post. This granted you a stronger support from SteemSTEM.
Congratulations @scienceblocks! You have completed the following achievement on the Steem blockchain and have been rewarded with new badge(s) :
You can view your badges on your Steem Board and compare to others on the Steem Ranking
If you no longer want to receive notifications, reply to this comment with the word
STOP