Happy Thursday. Sometimes it’s amazing just to see relentless pressure to push the PA higher.
Seems now Bitcoin is being taken even more seriously as a competitor to conventional fiat currencies - Enough so that Bitcoin Core has just released a new experimental software update called “Asmap” which is designed to hedge the chain from potential malfeasance and attacks from “players the size of nation-states which could effectively fracture the Bitcoin network.”
Latest Bitcoin Core Code Release Protects Against Nation-State Attacks
Hardening the network against nation-state malfeasance and bad actors is a significant achievement given the current appetite for stimulus and currency debasement from countries worldwide. Interesting times.
With that, let’s get into the Technical Analysis
The 4H Intraday Chart
Looking at the 4H Intraday Chart, the formation continues to progress through a regular Wyckoff Accumulation pattern. The formation has just pushed past the key resistance level of $9,680 established earlier, signaling a Sign of Strength (SOS) on the most recent Upward Thrust (UT).
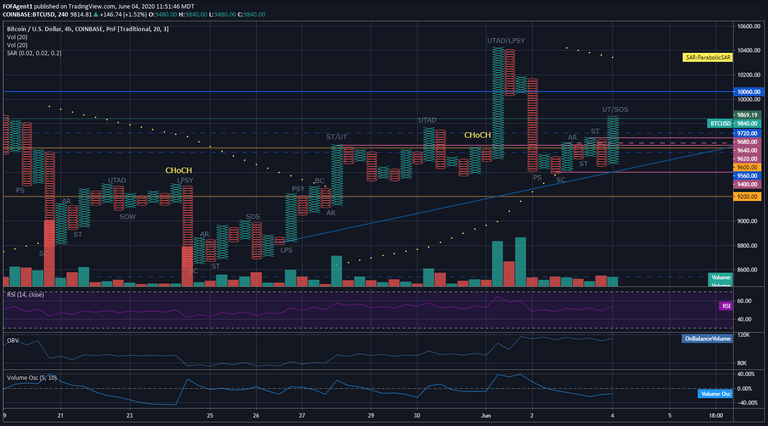
One key piece to keep an eye on as the PA continues, is the formation is starting to hug the bullish support level formed by the Last Point of Support (LPS) at the $8,820 level. A break in this support line would flip bias from bullish to bearish on this Intraday chart.
The PA appears to have stalled out at the $9,860 level on the current rise, and we need to peek at the 15M Intraday chart to get an idea why that’s the case…
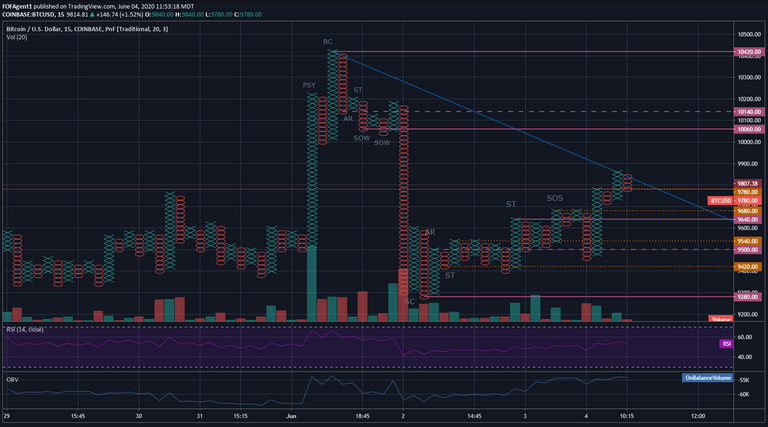
On the 15M Intraday we can see since the Secondary Test (ST) resistance line at $9,640 was broken, the formation has continued to advance in a stepping-stone method in triple-top and double-top breakouts (both triple top and double tops are bullish in Point and Figure) all the way through the $9,860 price level, before running into resistance from the trendline established with the recent high of $10,420.
Between the 4H and the 15M Intraday charts, I am left with the impression the price may pull back before advancing again. If the formation is in a Wyckoff Phase E Accumulation, I would imagine the formation pulls back to about the $9,640 level before advancing again. However, if the formation remains in a Wyckoff Phase B Accumulation, while unlikely, I could see the formation potentially pulling back as far as the lower end of the trade range to $9,280 before advancing. I think in my mind, the most reasonable lowest low on the pullback might be resistance at $9,420.
Currently the formation on the 4H Intraday has $420 of cause built in from the consolidation, which suggests a price target of $9,860, should the low at $9,460 behave as the Last Point of Support (LPS). As the consolidation continues, more cause will be built into the formation, requiring a target price re-calibration.
The 1D Chart
Looking at the 1D chart, the formation remains with Phase B of a normal Wyckoff Distribution. Typically, after a Phase B upward thrust, the formation will begin to print lower highs as large interests are net sellers of Bitcoin and have the goal of exhausting as much of the remaining demand as possible.
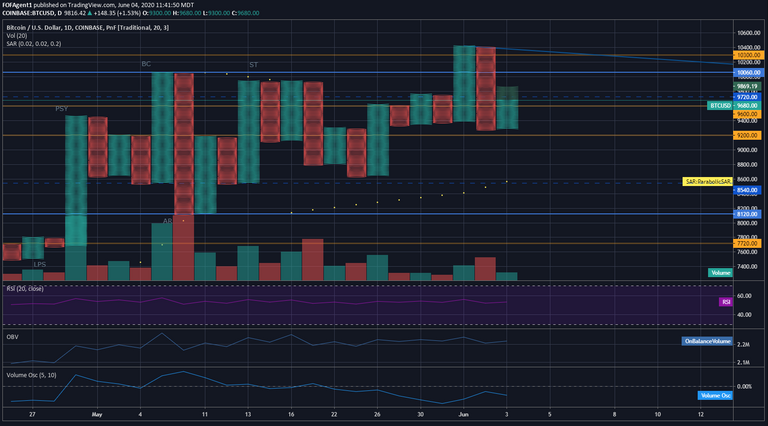
My expectation is the 1D formation should begin to print lower highs over the near term before moving onto Phase C of the Wyckoff Distribution. Counterintuitively, shorter intraday time frames such as the 4H and 15M charts are signaling short term Wyckoff Accumulation is underway - think of it as a microcosm of Intraday activity which is encompassed by the consolidated view of the 1D.
I would expect to see more stepstone accumulation and distribution to appear, and move the formation into the higher $9,000’s region ($9,800 - $9,900) should the recent should the low at $9,460 behave as the Last Point of Support (LPS). Should a reversal candle print on the 4H, this would suggest consolidation will continue, and I would imagine the $9,900 - $10,000 region will be the eventual target before dropping back down to form another lower high and so on over the near term until Phase C begins.
Always remember this is not trading advice.
Outside of that, Happy Trading.
EDIT: Price Tagrget of $9,860 was realized. Damn, that didn't take long after posting....
*
You can follow me and keep up to date on Tradingview as well. I trade under the handle FOFAgent1 at tradingview.com