Happy Monday everyone. This morning on CNBC I came across an interesting article about the current global dollar shortage and the moves the FED is taking to provide access to dollars during this massive (and temporary) surge in demand. It’s fascinatingly counter-intuitive in light of the recent waves of money printing from the FED and the US Treasury.
A Global Rush Into the US Dollar is Driving Extreme Market Moves and a Temporary Shortage
Recently there has been a bunch of activity with Tether and other Stablecoins, suggesting a broader move into the cryptocurrency space, and potential pent up demand for Bitcoin. I speculated at one point, some of this might be attributed to investors and businesses moving their cash into stablecoins to hedge against the ramifications of negative interest rates, bank liquidity issues and fees. Shortly after Jeremy Allaire of Circle had some similar thoughts on the subject based upon what they were seeing as well.
Circle CEO Claims ‘Explosive’ Stablecoin Demand From Everyday Businesses
It would be interesting to see if Stablecoins become a stopgap for the temporary USD shortage in the coming weeks. Interesting times.
With that, let’s get into the Technical Analysis.
The 4H Intraday Chart
Looking at the Intraday Chart, the formation remains range-bound towards the upper end of the trade range (between $9,620 and $9,280) in a regular consolidation pattern for a Wyckoff Distribution Phase. The upper trend-line formed from the Upward Thrust (UT) on the Secondary Test (ST) remains unbroken, and no Change of Character (CHoCH) has been signaled at the time of this writing (which would suggest a move to re-accumulate from this normal distribution phase).
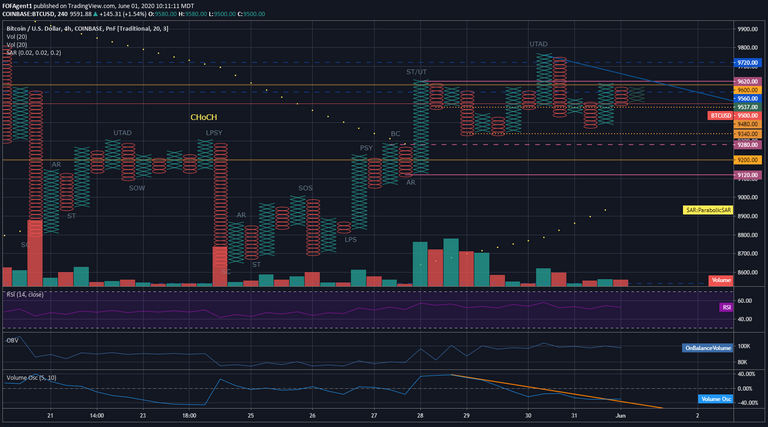
The formation appears to be in Phase B of a Wyckoff Distribution currently. My expectation for the near future is the formation will continue to remain rangebound within the upper limits of the trade range (between $9,620 and $9,280) and potentially have another Upward Thrust (UT) before turning lower to retest the lower limits of the trade range (between $9,280 and $9,120) before printing a Sign of Weakness (SOW).
Currently there is approximately $1,020 of cause built into the formation during this consolidation period, which would suggest a current price target of $8,580. As the consolidation continues, more cause will be built into the formation, requiring a target price re-calibration.
The Volume Oscillator is again showing a bearish divergence from the formation and is printing a negative number (-39.32%), suggesting a strong shift in the current trend is on the horizon. For reference, right before the previous drop from $9,300 to $8,640, the Volume Oscillator signaled a bearish divergence and printed a negative number of similar magnitude (-45.78%).
The 1D Chart
Looking at the 1D chart, the PA is compressing towards the upper end of the trade range yet remains pinned beneath the upper trendline formed from the $10,060 high.
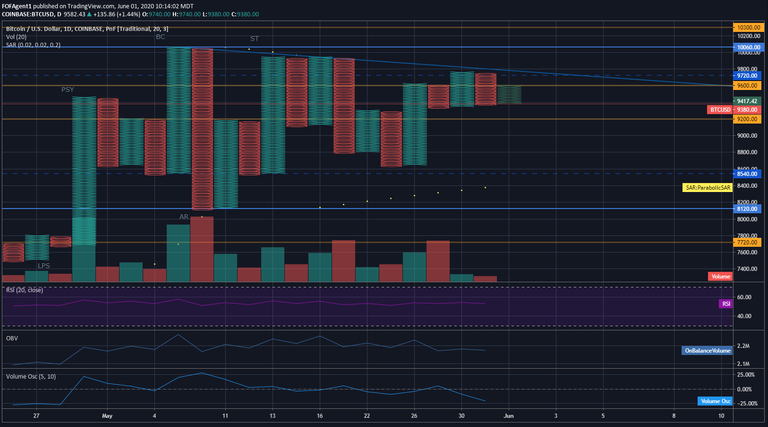
My expectation the formation will print a lower high over the next few days remains unchanged. My feeling is we will visit the lower end of the 1D trade range ($8,120), retest the lower end, and potentially establish a Sign of Weakness (SOW) down towards $7,700 before reversing and moving higher again.
Always remember this is not trading advice.
Outside of that, Happy Trading.