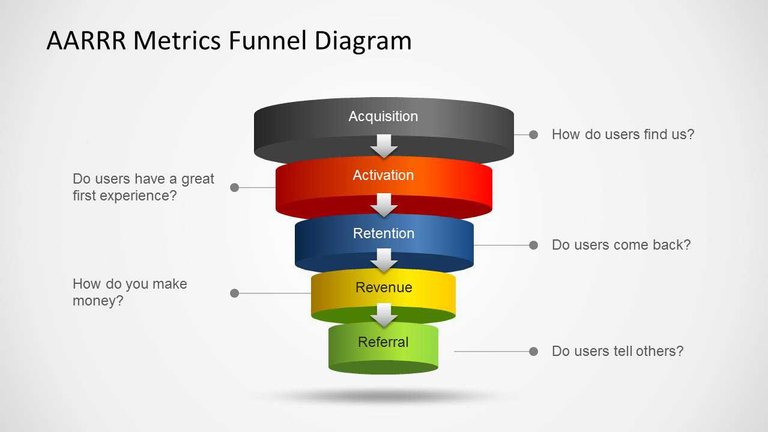
AARRR is an analysis framework developed by Dave McClure, founder of Startups Elchelator 500 Startups. AARRR focuses on actionable indicators that can help you optimize and focus on improvements rather than spending time on unnecessary indicators.
Most start-ups are very good at making products or services based on ideas, but are a beginner in effectively communicating products and services or steadily securing users.
So for many start-ups, AARRR is an efficient tool to gauge the status of services based on specific indicators that are relevant to the market entry stage. In particular, AARRR allows you to focus on the core indicators that are most needed at this point in time, from a myriad of data.
In other words, it is an attractive framework for start-ups that do not have enough manpower or time for analysis.
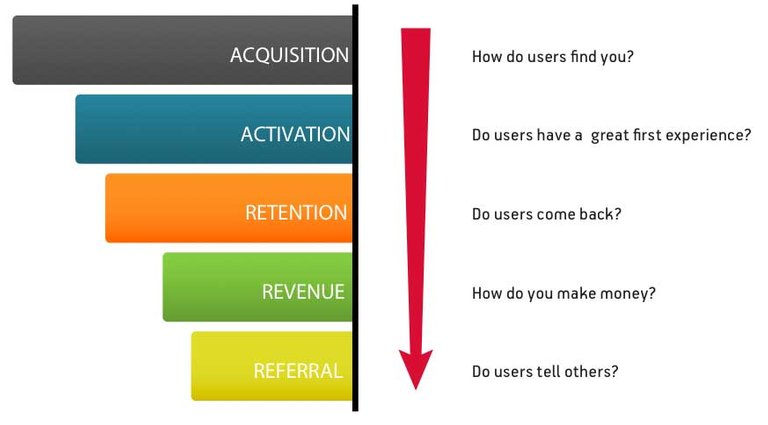
5 key indicators of AARRR

- Acquisition: How do users discover our service?
- Activation: Does the user provide a positive experience when using the service for the first time?
- Retention: What happens to subsequent service reuse rate?
- Referral: Does the user spontaneously make a word of mouth or share?
- Revenue: Is it connecting to the end goal(sales)?
Acquisition
Acquisition is a stage in securing customers and is an index that focuses on aggressive marketing to enter the market after stabilizing the service.
Understand how many users are coming in from multiple channels, how much new users are getting, and more.
When analyzing a channel through Acquisition, the channel that causes high volume at low cost is a good channel.
- Key Indicators: DAU, MAU, New User
Activation
The rate at which users leave before they use the service, or the percentage of engagements that follow when they start using the service. Bounce Rate is the percentage of service termination on the first page, which indicates a negative user experience.
- Key Indicators: Bounce Rate, Avg.PV, Avg.Duration, Signup
Retention
One of the most important indicators in the early stages of the business is Retention. Retention rate is the best indicator of service satisfaction. If service satisfaction is high, it shows high reuse rate. This means that the customer is using the product or service consistently.
However, if the revisit rate is low, the service is difficult to survive for a long time. In this case, you need to increase your retention rate based on various efforts such as pushing, mailing, and renewal in order to raise low retention.
- Key Indicators: Retention Rate
Referral
Referral is the important data in the stage of service stabilization and growth. You need to look at how and where the service is being shared, how many users it regains over the channel, and so on. Referral makes a virtuous circle in conjunction with Acquisition.
- Key Indicators: Channel, SNS Share Rate
Revenue
To maintain service consistently, you need a solid revenue model. Indicators that determine this may vary depending on the service. But obviously it will be a big help to increase the conversion rate of users who use the service.
- Key Indicators: Conversion Rate