Aave is one of the few defi protocols that has proven itself throughout the years. The market went up and down, but the protocol kept on going. The TVL has dropped in the bear market but not as bad, and it is up again these days. No hacks and failures on the platform up to date.
It is now by far the number one borrowing and lending protocol. Borrowing and lending for the new defi age.
In the recent period the token price has been surging even more!
Let’s take a look.
Aave works in simple way at first sight. Users deposit (supply) collateral in some of the tokens that are accepted on the platform and borrow against that collateral, another assets/tokens that are listed.
A classic example would be deposit BTC as collateral, borrow some stablecoin, for example USDT.
The main thing to look out for is the health factor or the supply to borrow ratio and avoid liquidation. By design the protocol has limits and it won’t allow you to borrow more than 70% of the value of the assets you have supplied. But this being crypto you want to be much safer than that and go in the range of 10% to 30% loan to collateral value. This means a 10k collateral for 1k to 3k loan. Managing this ratio is at the end of the day an individual decision, but just have in mind the overall rules.
More to read on Aave on the docs link.
Here we will be looking at:
- Total value locked
- Deposits volume
- Defi protocols rank by TVL
- Number of users DAUs
- Top Pairs
- V2 VS V3 Volume
- Price
The data here is compiled from different sources like DefiLama, Dune Analytics and Messari.
Total Value Locked
Here is the chart for the TVL on AAVE.
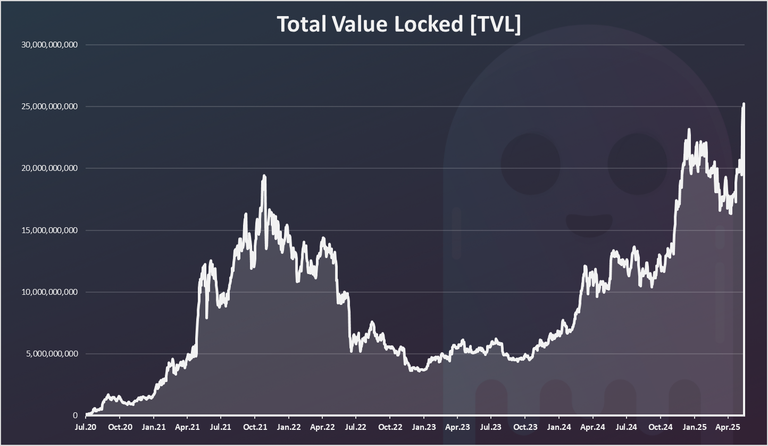
This chart goes back from the protocol beginning back in 2020, through the bull market of 2021 and up to date.
AAVE just hit a new ATH in total value locked!
Back in the previous bull market the TVL reached 20B and now we are at 25B!
We can notice the sharp increase in the TVL in 2021, reaching almost 20B in the summer of 2021. Then a drop to a record low of 4B in 2023. It was around this number for a while and started growing again in 2023. A massive spike in the last weeks and a new ATH on TVL.
Deposits Volume
Unlike the swaps and trading platforms, there is no active trading on Aave, but still there are deposits, borrows, liquidations etc. Here we will be looking at the deposits as there is where the most volume is.
The chart looks like this.
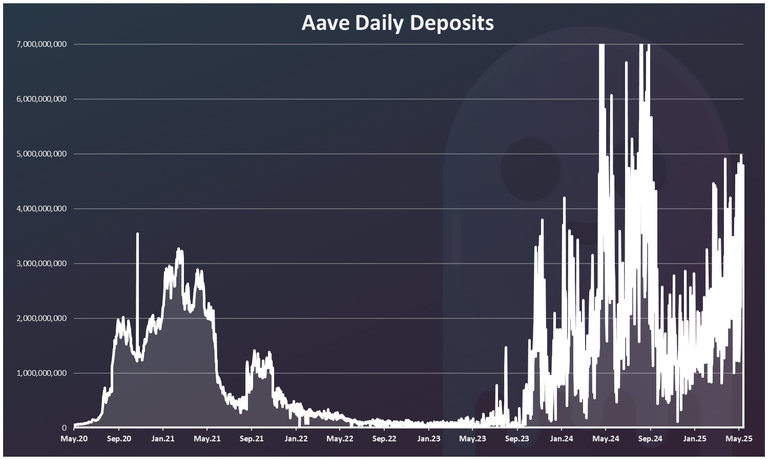
This is even more volatile than the TVL. Interesting there were a lot of deposits starting from 2020, earlier than the bull market in 2021. This is probably due to the fact that Aave was a new protocol then and it was basically starting from zero TVL.
After the initial boom in deposits there was a drop in 2021, then an increase again in August 2021, and later a further drop in the deposits. In the second half of 2022 and the first of 2023 there was a sharp drop in the deposits
Starting from October 2023 the deposit volume started to increase, and it has been quite volatile in the period, going from 100M to more than a billion on a daily basis. In the last few months the deposits are on the rise again.
Top Defi Protocols Ranked by TVL
How is the Aave protocol doing when compared to the other ones? The total value locked is usually one of the metrics these protocols use.
Here is the chart.
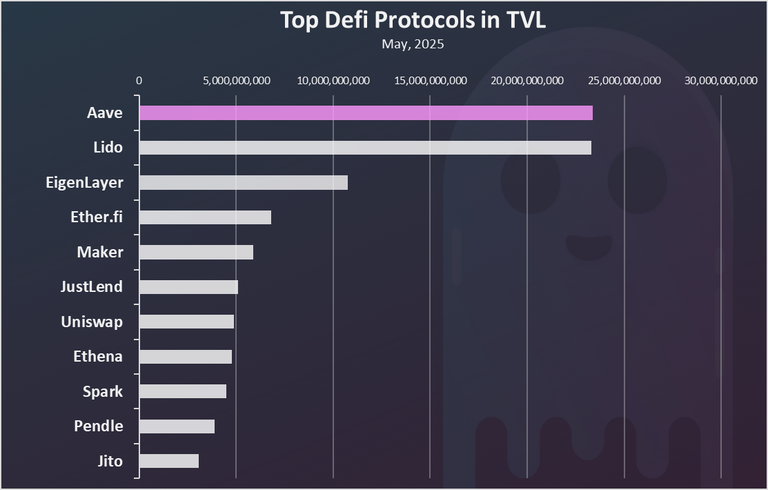
Aave comes as no.1 protocol in terms of TVL and just surpassed Lido, that has been on the number one spot for a long time!
The Lido protocol, that is the no.2 on the chart in TVL is a bit specific. It is used for ETH staking, and it has only staked ETH in it. Another protocol for staking ETH on the third spot Eigne Layer.
Aave is dominant for the other protocols, it has surpassed Maker as well by a lot, a long-term competitor of its.
Top Supplied and Borrowed Assets on Aave
What are the assets that have the biggest supply on Aave?
Here is the chart.
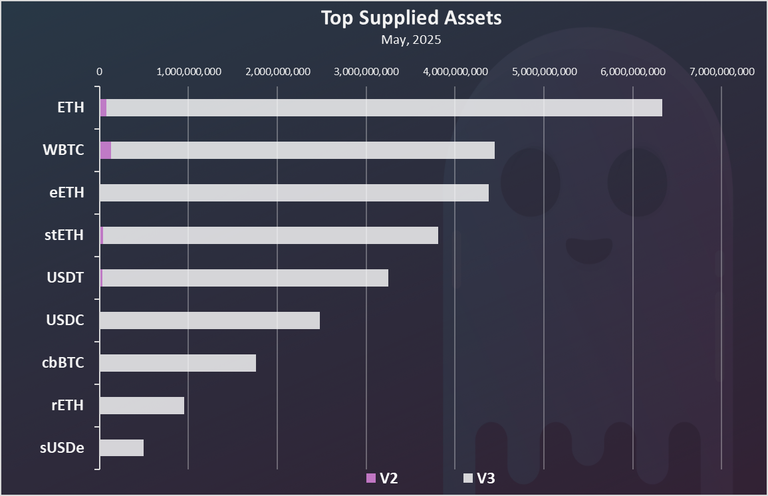
Aave has a V2 and V3 versions, and both are represented on the chart above. We can see that the V3 version is now dominant by far.
As we can see Ethereum is the number one asset that is supplied on Aave, in both of its forms, liquid and staked. This is probably to a no surprise because Aave is native to Ethereum.
The wrapped version of Bitcoin on ETH comes next, followed by the stablecoins USDC and USDT.
What about the top assets that are borrowed?
Here is the chart.

ETH comes on top here as well followed by USDT and the others stablecoin USDC. Bitcoin is also at the top. The other tokens have a very low usage.
We can notice that in general Bitcoin, Ethereum and the stablecoins are the most used tokens to supply and borrow.
The borrow to supply ratio for the different assets looks like this:
| Pair | Supply | Borrow | B/S |
|---|---|---|---|
| USDT | 3,220,000,000 | 2,980,000,000 | 92.55% |
| ETH | 6,250,000,000 | 5,400,000,000 | 86.40% |
| USDC | 2,480,000,000 | 2,020,000,000 | 81.45% |
| stETH | 3,770,000,000 | 865,000,000 | 22.94% |
| WBTC | 4,320,000,000 | 386,000,000 | 8.94% |
The most borrowed asset in relative terms are the stablecoins. USDT comes on top, followed by ETH and then USDC. These three have a Borrow to Supply ratio close to 90%. Meaning most of the provided liquidity is used.
Bitcoin has the lowest amount of borrowed ratio close to 9%.
Active Users
How many users does Aave has? Here is the chart.
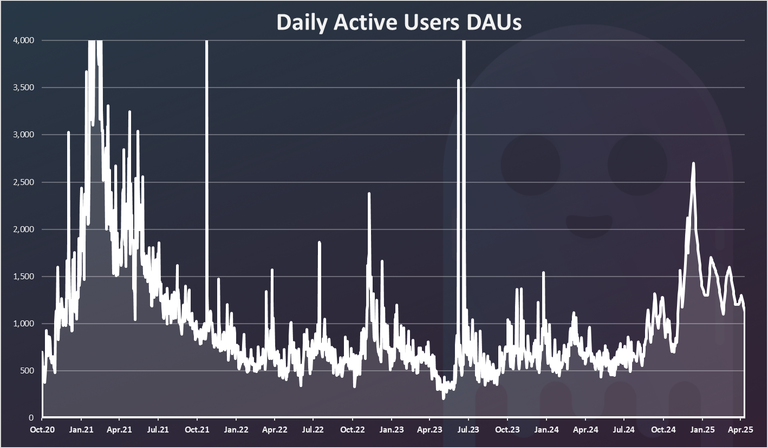
The top for active users on Aave was back in the beginning of 2021, reaching 3k. At the end of 2021 the user count started decreasing and reached 500 users in 2022.
In 2024 the number of daily active users has been in the range of 500 to 1000, up to the last period when it spiked up to 2.5k.
This goes to show that most of Aave users play with larger amounts and don’t change their positions on a daily basis. It’s a long-term game when you borrow or lend.
Price
The all-time chart for the AAVE price looks like this.
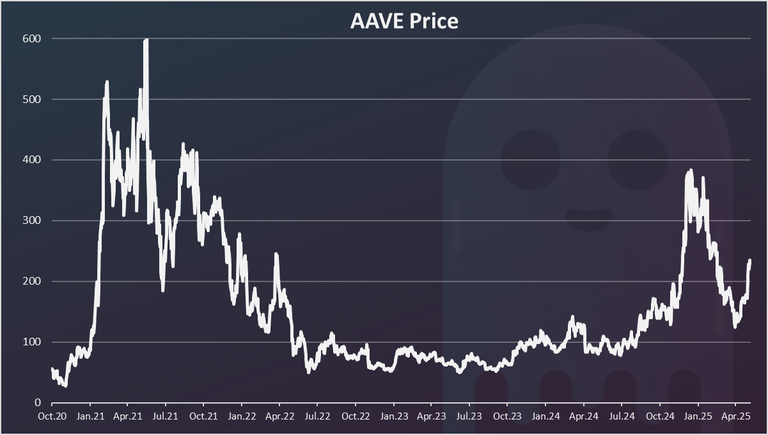
Aave reached its top of $600 back in the summer of 2021. In 2022 the price has dropped to around $50. It has been in the range of 50 to 100 USD for more than a year, then it broke the 100 in 2024, and went almost parabolic in the last month reaching almost 400, and dropped again under 200.
A slight recovery in the last weeks but still far from the 600 previous ATH.
With all the latest developments, AAVE has shown that is a project here to stay in the ranks of the few big DeFi apps.
All the best
@dalz
Aave is about the only "DEFI" platform I will use anymore outside of swaps. I love it. It gives a real solid use case and the features like being able to swap both the collateral and the loaned asset is second to none. Gives you the ability to build you supply stacks on long trades and short away your loans. That's if you are going to use debt against your stack. I have become a spend and replenish kind of guy because I am trying to support crypto based business or I just get gift cards instead of selling for fiat on a centralized exchange that reports to authorities, so I don't worry about playing the whole 'debt is income' game anymore.
If we had an Aave like platform on Hive, that would be the Tits McGee!
Aave like platform on hive would be amazing. Especialy if it can be done with HP.
This post has been shared on Reddit by @acidyo through the HivePosh initiative.
The price pumped same time of hive pump
yes, lots of UP potential it seems, looking at the chart. 👊😉
ave to aave !LOLZ
lolztoken.com
... sky diving is not for you!
Credit: reddit
@dalz, I sent you an $LOLZ on behalf of pocketrocket
(1/1)
NEW: Join LOLZ's Daily Earn and Burn Contest and win $LOLZ
Lol :)