Since the events predicted in our last Bitcoin technical analysis came to pass, it was only fair that we analyze BTC another time and provide answers to a question everybody is asking. Is Bitcoin going to plummet under $10,000?
In order to do that, we have taken a look at BTC/USD daily chart.
Bitcoin Technical Analysis - The Trend Rejection
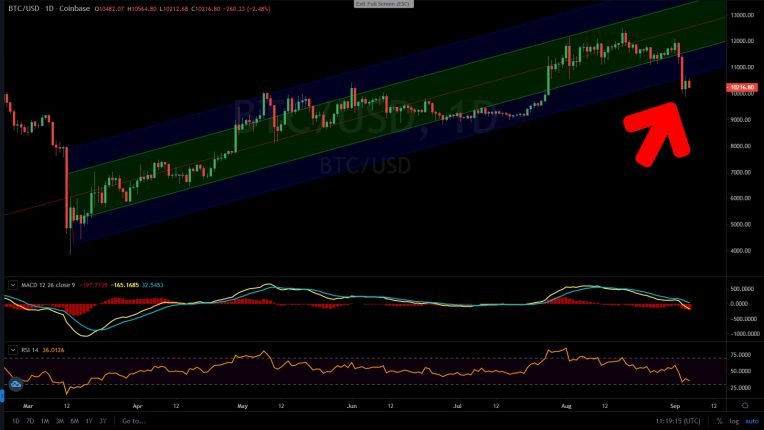
The chart above shows that, since March, Bitcoin has been traveling inside the ascending channel. However, the last price spike failed to reach the rising resistance line despite the widespread enthusiasm among investors.
If we zoom into the same chart, we can see the trend rejection, confirmed on August 17th. The uptrend got rejected as the RSI failed to go above despite the price still rallying.
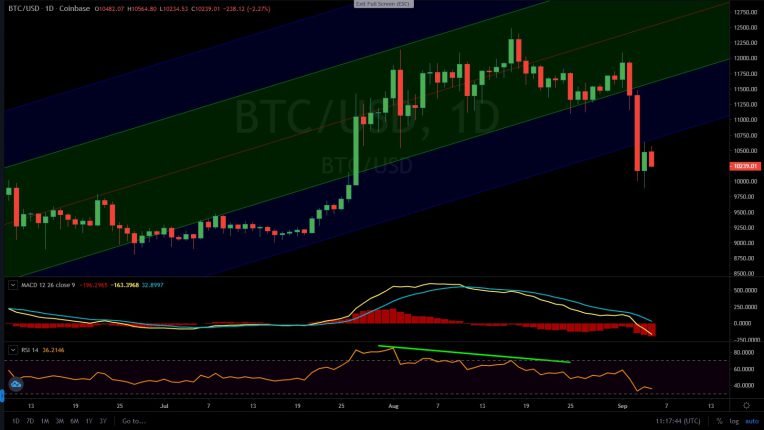
Additionally, the MACD readings reveal that the trend got weaker as Bitcoin approached the $12,500 high price. When we combine all these indicators, it becomes understandable why BTC failed to withstand the selling pressure and slid towards $10,000, falling under the channel's support line.
How Low Can Bitcoin Go?
In order to answer this question, we need to take a few technicalities into account. First and foremost, no trader should neglect the 200MA, which frequently marks the future support or resistance.
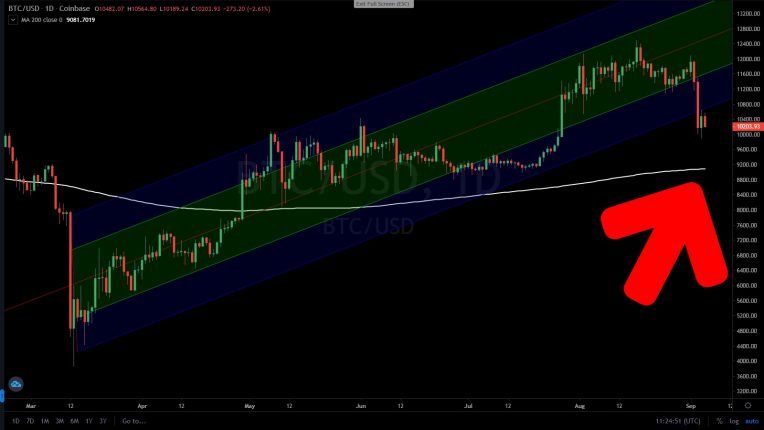
As it is visible in the BTC/USD daily chart above, the price is yet to reach the 200MA and test the level. If are to talk prices, if Bitcoin continues the decline, it should meet 200MA at approximately $9,000. Looking at RSI, which has yet to pass into the oversold area, it is quite possible that we'll see Bitcoin at that price again. Furthermore, the MACD indicator is currently in a neutral area, with the tendency to pass below. Both of these possible occurrences will cement Bitcoin's trend reversal and lower the price a few percentages more.
Bitcoin Technical Analysis - The Derivatives Market

In our Bitcoin technical analysis, we do our best to wrap our heads around all aspects of cryptocurrency trading. Therefore, and in order to provide the most extensive set of information, we have taken a look at BitMEX BTC/USD perpetual daily chart.
Why BitMEX? Because, currently, it is the biggest cryptocurrency derivatives market.
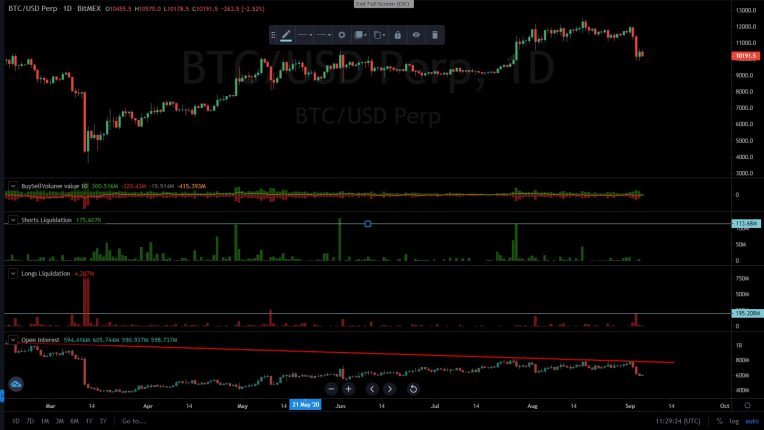
The chart above clearly shows that, since late February, the open interest for Bitcoin derivatives in the market has been declining. Nevertheless, bulls in the spot markets continued to push the price further up. This resulted in massive liquidations of short positions of more than $100 million in April, June, and July.
Yet, on September 2nd, bears got their way when the open interest suddenly declined by $200 million (from $770 million down to $550 million. This represented the lack of new capital in the Bitcoin futures market. Consequentially, the price started declining as Bitcoin slid under the ascending channel.
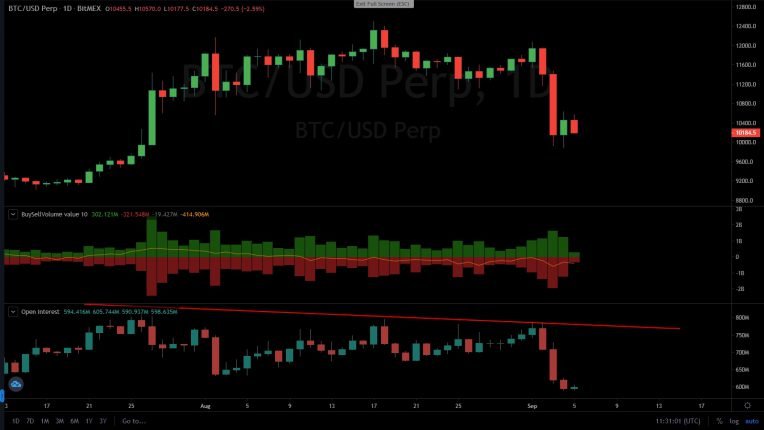
Moreover, the buy/sell volume remains negative since August 17th, revealing the negative investors' sentiment towards Bitcoin during the last 20 days.
There are many negative technical indicators in the bitcoin market at the moment. Therefore, it is highly probable that BTC is going to go below the current value. However, what prices traders should be looking for to enter the market or place long orders again?
Prices to Look For
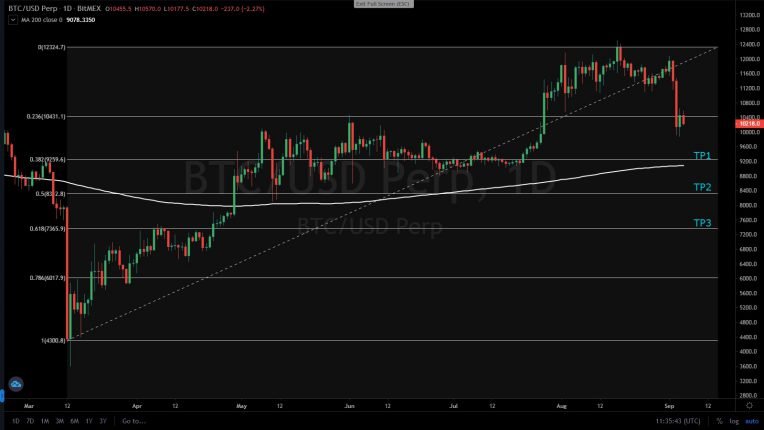
Fo those shorting Bitcoin, we are going to name these level target prices (TP). Our readers who are waiting to enter the market will view these prices as good entry points. Anyway we name them, these are the possible levels Bitcoin should hit before another trend reversal.
As the chart above shows, Bitcoin already broke through the 0.382 Fibonacci level during Thursday's violent selling session. Therefore, the first price to look for is between $9,200 and $9,000. Especially since it coincides with the mentioned 200MA.
If Bitcoin breaks that level, the only levels that can keep it from the total defeat in 2020 are 0.5 and 0.618 Fibonacci at $8,500 and $7,500 respectively. Therefore, we recommend looking at these three levels as crucial at this moment. However, we recommend even more to set those stop-losses up in case of any unpredicted price movement.
All charts in the article were analyzed on Coinalyze.net – the professional crypto trader’s analysis tool.
Disclaimer:
You should look elsewhere for investment advice since this isn’t it. Even if it looks like it, it’s not. Cryptocurrencies are extremely volatile and risky speculations. Always do your own research. Consider consulting an investment professional prior to investing your money.
Please, in the comments section below, let us know where do you see Bitcoin at the end of 2020. We are excited to hear your opinion.
 When you start feeling the irresistable urge to share our content and click on one of the sharing icons below, you'll be rewarded with Sharpay (S) Tokens.
Now, ain't that cool or what? Getting paid for sharing!!
Of course, to receive your tokens, you'll need a Sharpay crypto wallet. Therefore, first you need to register on Sharpay's OFFICIAL WEBSITE and the wallet is there.
When you start feeling the irresistable urge to share our content and click on one of the sharing icons below, you'll be rewarded with Sharpay (S) Tokens.
Now, ain't that cool or what? Getting paid for sharing!!
Of course, to receive your tokens, you'll need a Sharpay crypto wallet. Therefore, first you need to register on Sharpay's OFFICIAL WEBSITE and the wallet is there.
Thanks for sharing!
😉
Originally published on CoinSyncom: https://coinsyn.com/bitcoin-technical-analysis-is-btc-going-below-10000/
Congratulations @coin.syncom! You received a personal badge!
You can view your badges on your board and compare yourself to others in the Ranking