Conclusion for today’s Bitcoin technical analysis: Price closing below ~8883.35 implies lower prices for Bitcoin.
Bitcoin technical analysis for today (July 21, 2019) is carried out on an intraday timeframe (6 hour) candlestick chart. A log scale of the chart shows the bullish trendline drawn for Bitcoin that has been active since March of 2019.
Instagram: https://www.instagram.com/coin_analyst/
Twitter: https://twitter.com/Cryptotrader029
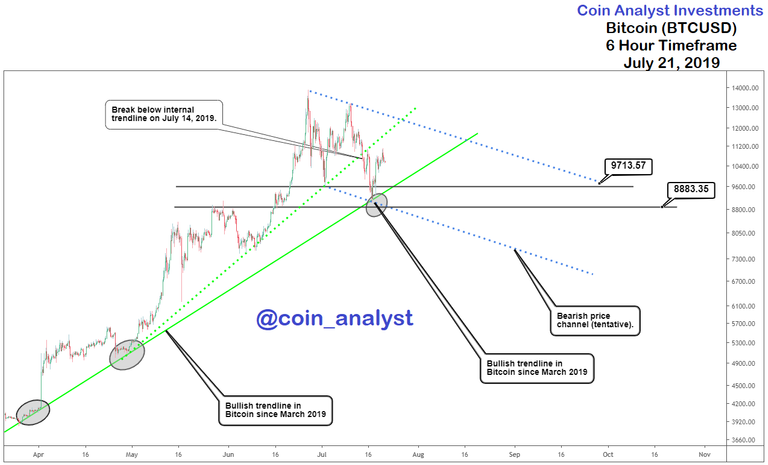
The trendline was successfully tested on April 29, 2019 and again on 17 July 2019 when price reached a low of ~9092.00. These imply higher prices for Bitcoin (BTCUSD).
However, bearish signs that indicate caution for the current uptrend include price reaching a peak of 13,200 before turning downwards, and also the July 14, 2019 break of the internal trendline. Last but not the least providing evidence for a bearish bias is the price channel (tentative) highlighted on the chart.
Price level of support as indicated on the chart is between 9713.57 and 8883.35. A break below the lower boundary of support (8,883.35) which also coincides with the lower boundary of the channel increases the likelihood of a downtrend.
Bitcoin targeting the low 7,000’s on a close below 8,883.35 is therefore highly likely.
Our previous Bitcoin analysis (BTCUSD) before the current price rally was also posted for FREE and can be found here.
https://coinanalyst.investments/2019/04/26/btc-analysis