Regular daily update on BTC ta analysts opinions.

My summary - sentiment: neutral (last: slightly bullish)

- Another week down the road and we are back nowhere.
- Analysts are very mixed. 3 slightly bullish and 3 (slightly) bearish.
- In my point of view the bears are more clear about being bearish and it seems at the moment that the bulls just don't want to give up "yet". Also the missing volume during this run up and the missing follow up on that make me believe that we see another round down. The next days will show - for today we have a neutral overall.
News about the blog
- Please welcome @passion-ground in the round of analysts here. He was already quite active in commenting and I am very happy to finally include him here.
Thanks to @ew-and-patterns I saw his first analysis with a broad outlook on where we could go. I found that an interesting holistic look on things which I have missed so far. That is why I also thought this will be helpful for you guys and so I followed him closely since than. He is focussing more on the weekly update (which I find a good thing) (also other asset classes) but has posted the last days very regularly. I like that approach. Thankfully he also tried to provide his information already in an easy way for me to pick it up - Thanks for that!
Like always - what I can provide here is just a summary and it is worth digging into details. Therefore please feel free to follow the links in the reference section to his detail posts and follow him directly. - I also updated the table layout a bit (thanks to @passion-ground) to be more precise. Also updated the definitions tables so that you find out easily.
- The other analysts - I need to postpone to add them again - I was sick this week and still are so I am just missing the time to do that properly.
Analysts key statements:
Tone:
The update is where bitcoin was at 9'434 and still on it way up. So it is kind of obsolete now and so I keep it short today.
Daily: He is speculating that the secondary low may be in. It might be that the 1-4 day correction is in. Positive is that the secondary candle got support by the 200ma (around 9'030). But we are struggeling with the trend line as resistance (around 9'450).
He added another support which gives a triangle.
@haejin:
He sees subwaves of 5 (blue) of 5 (white) of C (red) in progress. Those could lead towards 8'200. If this fib 0.618 zone holds the bullish scenario stays in play. If we go below it gets invalid and a new count needs to be found.
@ew-and-patterns:

He posted several updates over the day to help us understand current move. That was highly appreciated. He sees that the bottom of current correction is likely in @8'360. The current drop he sees as part of wave C which is completed and now let us continue the bull momentum.
@lordoftruth:
As long as we keep above the 8'242 range the bull scenario is still valid. Also low volume gives the current moves not too much weight. Expected trading for today is between 8'242 and 10'150.
@philakonecrypto:
He sees that we start "curving" which looks like we found support. The signs are still very mixed and we need more confirmation. He suggests for trading: pick a side and stick with it.
A very significant resistance he sees at 11'700. If we break that we are set for good.
If we break 8'342 than we have a clear bear scenario.
What seems strange is the missing volume at key areas - that gives the feeling the correction isn't over.
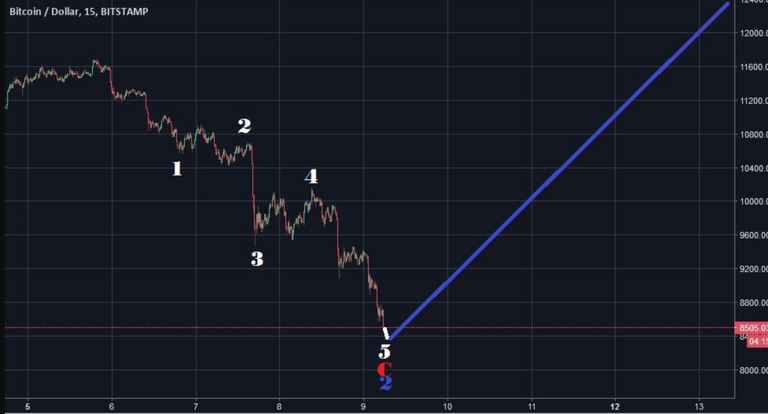
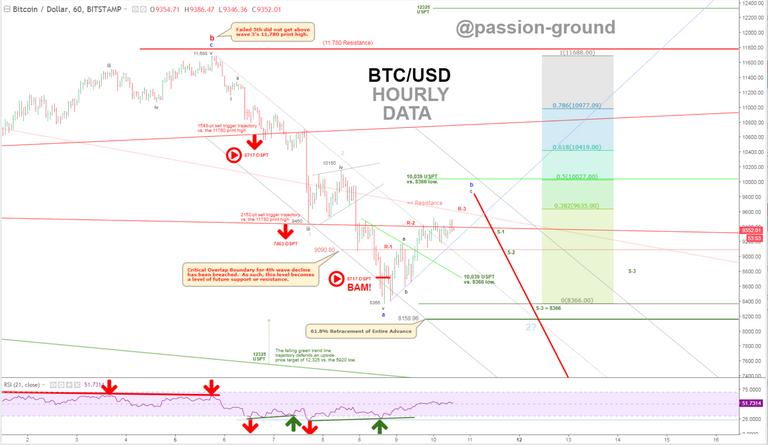
@passion-ground:
At time of his last update bitcoin price is at 9'350. He sees a price target for that move up at 10'039 but that he considers only as a "snapback rally" after which we will go down to 7'463. So he positions himself with a bearish mid-term outlook.
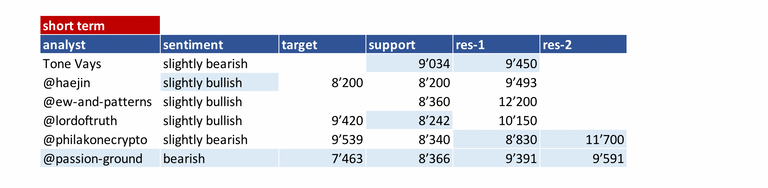
Summary of targets/support/resistance
Reference table
| analyst | latest content date | link to content for details |
|---|---|---|
| Tone Vays | 10. Mar | here |
| @haejin | 11. Mar | here |
| @ew-and-patterns | 8. Mar | here |
| @lordoftruth | 11. Mar | here |
| @philakonecrypto | 11. Mar | here |
| @passion-ground | 10. Mar | here |
Definition
- light blue highlighted = all content that changed since last update.
- sentiment = how in general the analysts see the current situation (bearish = lower prices more likely / bullish = higher prices more likely)
- target = the next (short term) price target an analysts mentions. This might be next day or in a few days. It might be that an analyst is bullish but sees a short term pull-back so giving nevertheless a lower (short term) target.
- support/res(istance) = Most significant support or resistances mentioned by the analysts. If those are breached a significant move to the upside or downside is expected.
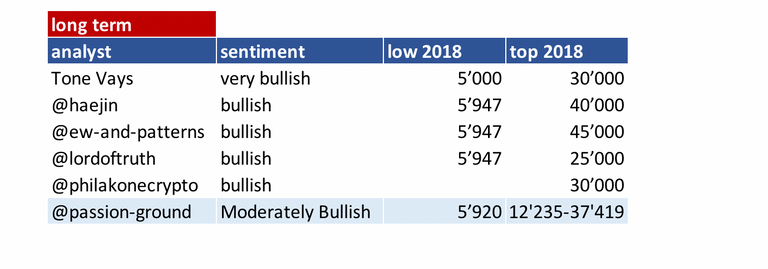
- bottom = -> now renamed and moved to long term table. Low 2018
- low/top 2018 = what is the low or the top expected for 2018?
Further links for educational purposes:
- From @ToneVays: Learning trading
- From @philakonecrypto: Like in every post you find links to his amazing educational videos. For example here
- From @lordoftruth: Fibonacci Retracement
- From @haejin: Elliott Wave Counting Tutorial
If you like me to add other analysts or add information please let me know in the comments.
Is Mt Gox done dumping bitcoin? If not are we going lower?
Gosh, @famunger! I can’t begin to tell you how honored I am to be added to your distinguished list of analysts! Charting, technical analysis, and EWT, like “music” – are things I love and have been drawn to for decades. I thought I was winding down my career in TA until a friendly discussion came about between me and @ew-and-patterns.
Much like the #openmic gets people back into playing their music again, both yourself and @ew-and-patterns, and many others who have been commenting, - all of you have inspired me to continue my passion for Chart Analysis. Thank you so much for that, it means a great deal to me. Cheers!
The honor is just on my side and we all are very thankful @ew-and-patterns kept you into TA ;-).
I hope you feel well represented and thanks again for making it easy for my using tables with key information. That really helps in terms of efficiency but much more about being sure to get your ideas right!
If you have further ideas for improvement. Just let us know!
Thanks for sharing update...resteemit done...
its very good post...thanks for sharing...resteem done
About what time range are we talking for the „long term“ data?
Seems weird that, Tone Vays is considered the most bullish longterm but has the second lowest ATH for 2018!
Otherwis great summary, thx!
That is always a problem to be precise here because in fact it is a mix out of what the analysts understand here about long term when they are posting - as they are not getting any definitions from me. So it is not very well comparable probably. It just mean >6 month I guess. I may try to nail this chart to "2018".
Tone is just BTC maximalist - so I but him on "very bullish" - the "very" reflects also in comparison to alt-coins and not so much about a max price.
Like always that is the problems if you summarize things - certain information gets lost but I hope that helped clarify.
Probably would be nice to ask them about their definition of longterm - I am with you, longterm should be at least 6 months, probably even at least a year. On the other hand one year in crypto feels like 10 years in the "real world".
Ok, important information about Tone.
So would it be considered bullish to say that BTC will dominate the crypto market with 90% market cap in 2019, even if the total market cap drops down to 100billion$?
Definitely helped clarify - Especially the part of interpretation about "can it be bullish even if the total marketcap drops and the price is lower than now" is interesting imo.