Regular daily update on BTC ta analysts opinions.

Own comment:
- Daily charts is where the music is. It seems the resistance cluster at 11'000-11'300 is under attack. We are intraday above the downtrend. If we can go above that this would be a very good sign.
- It seems we are getting bullish momentum but I leave the "neutral" flag for today.
Analysts key statements:
- Tone: Weekly: We have a price flip and are staying above a fib line which is good. We are above the previous close. It is possible that we enter a "bull trap". That would come in the area of 15-16'000. That would come mid next month creating the illusion that we going back up.
Daily: good news is a green 2 above the green 1. We have broken 50 day MA (but we have to close above it). Resistance 2 is the trend line, resistance 3: 200 day MA, resistance 4 setup trend line 11'248, resistance 5 fib line 11'300. So many resistance in the way. If bitcoin is breaking all those resistance and closing at the 11'250 area we have a cup and handle. He is expecting this not earlier than end of this week (if ever).
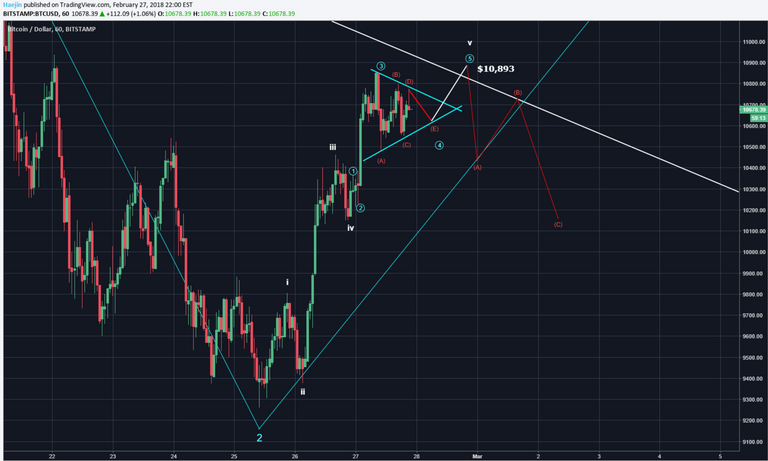
4hourly: instead of the expected pull back we got is a consolidation. - @haejin: Bitcoin is moving in an abcde triangle. Wave 5 is going to bring us out of it towards 10'893 (already happened - bullseye). That is followed by an abc correction bringing us towards 10'150.
- @ew-and-patterns: If btc manages to close above 10'500 we have the first daily close above the down trend line. If this trendline is history it might be that bitcoin is off to the moon. However another corrective wave could lead to 9'000 before we overcome the trendline.
- @lordoftruth: Bitcoin price surpassed 10'700.00 level as expected (another bullseye!). The price start to move toward the weak resistance at 11.7K. Bitcoin at 14'500 to 15'000 by end of March is still his call. Expected trading for today is between 10'150 support and 11'700 resistance.
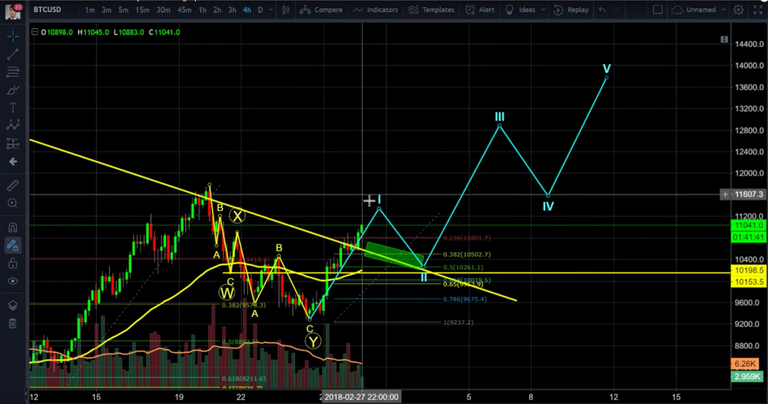
- @philakonecrypto: We need to break 11'250 USD to consider current move a significant uptrend. If we reach that level he is expecting some sort of retracement. Ideally to retrace to the down trend (now being a support) to restest it as support. It could look like the chart below (meant to be illustrative not meant to be targets).
Overall sentiment: neutral
(last: neutral)

Reference table
| analyst | latest content date | link to content for details |
|---|---|---|
| Tone Vays | 28. Feb | here |
| @haejin | 28. Feb | here |
| @ew-and-patterns | 28. Feb | here |
| @lordoftruth | 28. Feb | here |
| @philakonecrypto | 28. Feb | here |
Definition
- light blue highlighted = all content that changed since last update.
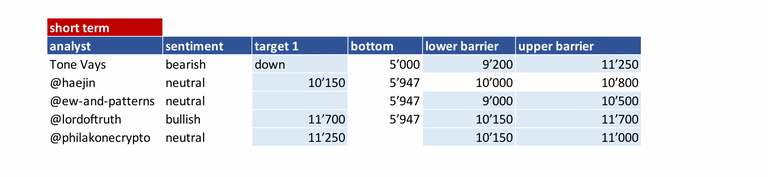
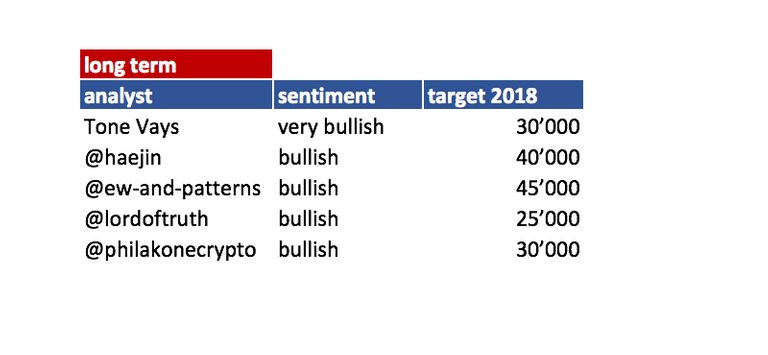
- sentiment = how in general the analysts see the current situation (bearish = lower prices more likely / bullish = higher prices more likely)
- target 1 = the next price target an analysts mentions
- bottom = price target analyst mentions as bottom
Both target are probably short term (so next few days/weeks) - lower/upper barrier = Most significant barriers mentioned by the analysts. If those are breached a significant move to the upside or downside is expected. It does not mean necessary that the sentiment will change due to that (e.g. if upper resistance is breached it does not mean that we automatically turn bullish).
If you like me to add other analysts or add information please let me know in the comments.
Thanks again for hard work and great content..
Small update:
There are also bullish flag pattern. Traders on the 4-HR chart, waiting for a likely return-move to retest 10.15K level, before entering a long position, they will place a stop-loss anywhere under key level, below 10 K - Target 1: would be 11.7K .. Target 2: would be 12.8K on near term.
Note, Bitcoin price was able to draw some gains the last days, even though equities and commodities closed lower. This marks a shift in the dynamic wherein bitcoin usually trails these riskier assets and benefits from risk appetite
Thanks for the additional comment! It looks like you are right again. ;-)
How many of these TA analysts predicted the latest dip? Did hajien warn of the Chinese New Year dip? Just curious.
Neutral could mean consolidation sideways move for a while then finally move up or down drastically breaking out? what you think?
Yes - that is an option but in my opinion unlikely (bitcoin usually moves strongly up or down). Neutral means more that there are so many mixed signals that the analysts have not confident forecast or that we have mixed opinions among the analysts (like here - some are bearish and some bullish). Hope that helped?
good post, I really like your post
Thanks for great post..i appreciate this cryptocurrency..
Great man reallyt show
a correction before the upmove would be nice (9.600 is my prefered level)
excellent analysis.
its a very helpful post, thank you.
At the current time bitcoin rate doewn. All steemer suffering depression
Looks like bitcoin is going up again.
Bitcoin is an amazing and workable currency in current world.. i appreciate your post. thanks for sharing
Thanks for the great summary once again!
Good post.....thanks for again important information about bitcoin..... @Famunger
I like the picture!
I love this concept of summary of analysts. Maybe if you feel it's worth it, consider for the future (adding more analyses i.e. more data, and) developing some sort of centralizing indicator? It should be doable through a little bit of algho coding, but it does mean some work, so it's totally up to you obviously, just leaving this idea here. I, for one, would absolutely LOVE such a thing!