Finding the bottom

My current main task is to research and educate myself so that I have a strategy to identify the bottom of the current bear market. In my opinion this can be s.th. between month and years so I need something which I can check on a regular basis and which give me a good indication where we are.
This does not need to be more often than on a bi-weekly or even monthly basis. Such short term run ups like today won't mean the end of the bear market to me and probably reveal themselves as dead cat bounces.
I started the monthly statistic blog just for that reason. As a reminder for myself to look at this data to identify trends.
In this post I like to give you some insights for what I am looking for. Feel free to share your perspective.
Consensio - defined by Tyler Jenks
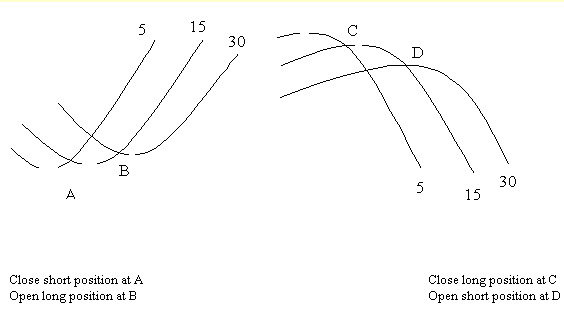
Weekly moving averages 2, 7, 30 - all need to trend up. 2 needs to be above 7 and 7 above 30. Price needs to be above all trend lines. At that point I want to be fully invested.
At the moment: 100% bearish
NVT - Signal Woo bull
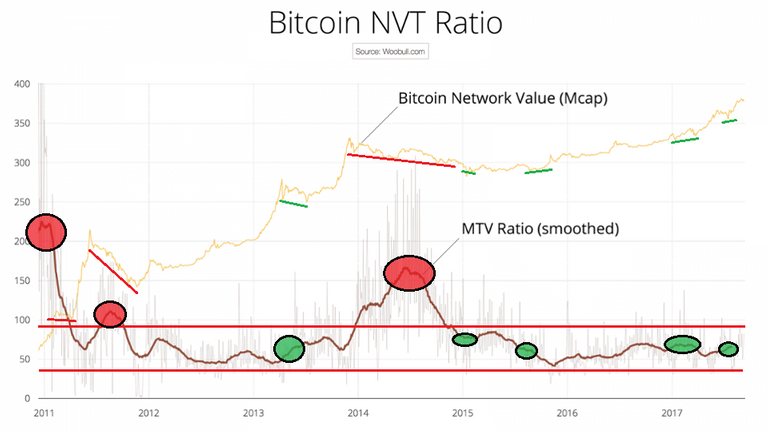
NVTS = Network Value / 90d MA of Daily Transaction Value.
Needs to be in the channel between 30-90. For bottom indication it usually touches the 50 level and below.
At the moment: 75
Network Momentum Woo bull

Network Momentum is a view created by PositiveCrypto which looks into the value transmitted through the Bitcoin blockchain denominated in BTC value plotted against Bitcoin`s price. It serves as a leading indicator to bitcoin price, in that we need high levels of value throughput to drive the bull market. This indicator is experimental.
Needs to reach 200'000 BTC transmitted through the blockchain. This indicates "Momentum" on the blockchain which is necessary to start another bull market.
At the moment: 175'000
Overcome key resistance

6'000 area hold us up in 2018 for a very long time. This level will act as major resistance. We need to overcome this level and hold above it (retest positive). That is a strong bullish signal.
We are nowhere at the moment.
Conclusion
If all criteria are met - I am fully invested.
If part of them are met - I will make a judgement call and invest 25%-75%.
in my opinion @ the moment we see a bullish flag forming on the hourly which will likely take BTCUSD and the whole crypto market up another leg. I would argue that if it finds resistance at $3630 and stays below that level for some consolidation while we see a rise once again in short positions, that scenario will likely result in higher highs over the coming days and will also indicate that a bottom is likely in for the crypto bear market of 2018.
I be.lieve that the bottom is not yet in. Since it is shorts that play a large role in putting in bottoms
what do you think about it?
follow me for more crypto ideas.
Great post and sound guidance, Chris!
What you describe is not so much identifying "the bottom" but rather a means by which to quantify when the long-term investment trend has finally turned back to bullish from the current bear cycle in which it remains firmly entrenched.
Thanks passing-ground. You are right - it is not really finding "the" bottom. It is when to reenter the market with a high likelihood of starting another bull market.
I am missing your "grand cycle" view on BTC. Any chance you going to update that some time? I would be very interested to read about your perspective on the grand-cycle now it is clear that 20'000 was the top of wave 5.
Like you, I have searched for and ultimately developed my own proprietary indicators to determine when to move in and out of markets in best serving long-term time horizons. I added bitcoin to the narrow mix of markets I currently track. You can find a page out of my official report here.
In keeping with my quantified trend model for BTC, the "Cycle" degree of trend remains down in a deep 2nd wave decline. With a decline of 84% already in place, the 2-wave at cycle dimension can bottom at any time going forward - or fresh new lows could take place to facilitate such a terminal as well.
In terms of "timing," I've already alluded to such here, however, as we both seem to agree - the only way to quantify high probability entry and exit points is via a predefined model that has a successful track record in doing so.
All of the other "predictive" and anticipatory technical speculation is just that - speculation. And though it can be entertaining and amusing to ponder the suggestions thereof, it more often than not leads to poor investment decisions. As mentioned before, it's best to have a simple and reliable strategy in place - and then nurture the iron-willed discipline to follow it to a tee - win, lose, or draw.
I like your money post.

MagicDice - Dice Game on Steem