SUMMARY
Note: For anyone who missed the BitcoinLive Information Webinar, here is the replay link: https://youtu.be/No4frLOz3UE
As of June 4th, ALL Crypto Analysis will be posted on the BitcoinLive channel and Steemit will be dedicated for Equity, Commodity and Option Analysis. To Signup for the BitcoinLive limited Founding Membership slots, use this link: https://get.bitcoin.live/haejin/
__
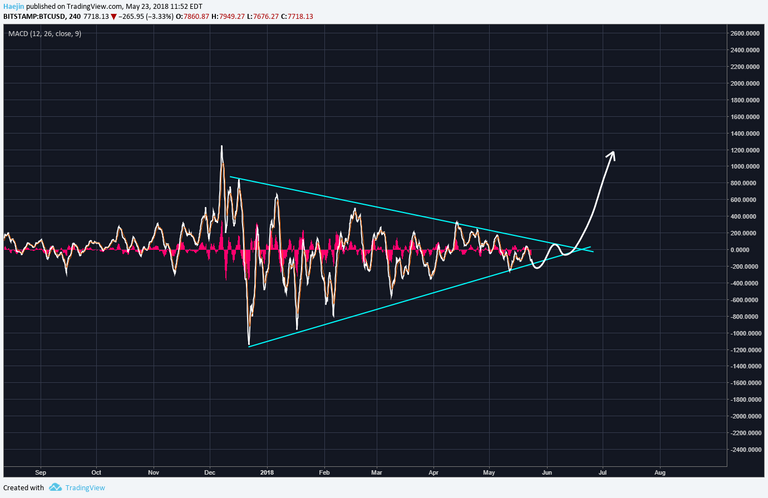
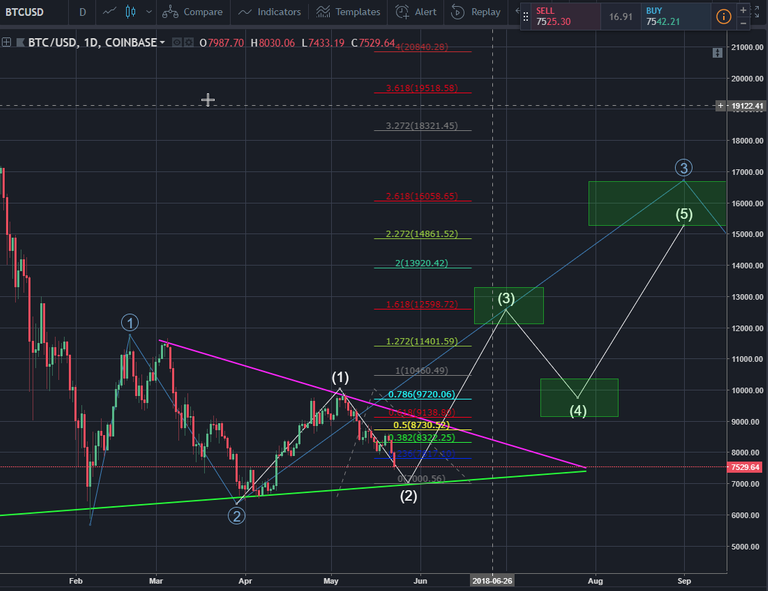
Here is the MACD indicator for Bitcoin (BTC). When viewing the price action in terms of this chart, nothing really has changed. It's still moving well within the contracting lines of the symmetrical triangle. It can and likely will but probably temporarily pierce the lower bottom trend line as shown by the white arrow. However, each day brings the MACD more and more proximal to the apex. I believe the bias is to the upside breakout (white arrow).
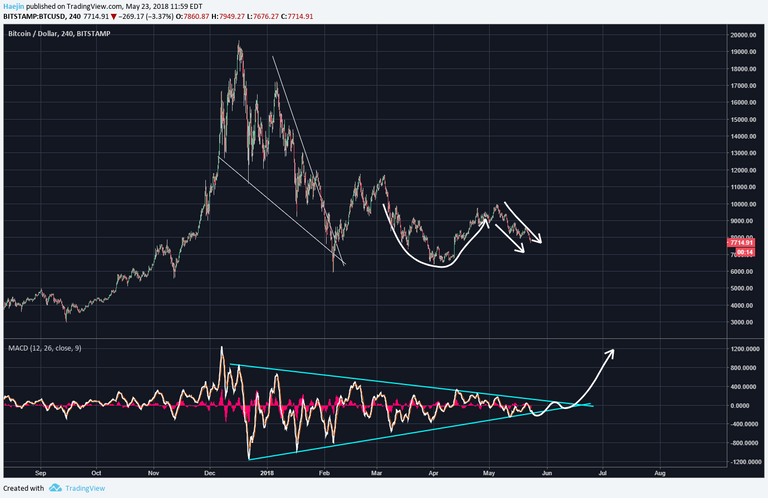
When viewing it with the price chart, you can see how the MACD movements are translated. Let's see what's changed. The Cup & Handle pattern remains valid. The current decline is a healthy correction from the recent five wave up move. Is it possible to have this pattern become invaldiated but still have the MACD within its pattern? Yes. However, the pattern doesn't become invalidated until the handle price goes lower than the lowest point in the cup formation. Discipline & Patience attract profits while Fear & Greed repel it.
Legal Disclaimer: I am not a financial advisor nor is any content in this article presented as financial advice. The information provided in this blog post and any other posts that I make and any accompanying material is for informational purposes only. It should not be considered financial or investment advice of any kind. One should consult with a financial or investment professional to determine what may be best for your individual needs. Plain English: This is only my opinion, make of it what you wish. What does this mean? It means it's not advice nor recommendation to either buy or sell anything! It's only meant for use as informative or entertainment purposes.
Please consider reviewing these Tutorials on:
Elliott Wave Counting Tutorial #1
Elliott Wave Counting Tutorial #2
Elliott Wave Counting Tutorial #3
Laddering and Buy/Sell Setups.
Laddering Example with EOS
Tutorial on the use of Fibonacci & Elliott Waves
@haejin's Trading Nuggets
Essay: Is Technical Analysis a Quantum Event?
Follow me on Twitter for Real Time Alerts!!
Follow me on StockTwits for UpDates!!
--
--


Bitcoin really pissed me off today. Im gunna go get drunk now bye
Guys check out this airdrop on the neo blockchain - after the massive surprise that ONT was this is well worth getting in on!
Use this link for extra coins when joining - here
See you soon $7,000 If we don't hold at this level expecting a drop towards $3,000.
Hope you're wrong about $3,000
Me too ;/
one thing we clearly forgot is as Haeijin Says " hurry up and wait syndrome". The 5 impulse waves up took almost a month and so correction must be equal or more to that time frame. it's another mistake that we made to assume correction was over but oh well we learn from our mistakes, next time keeping " time -factor" in prospective will help ease the pressure. Anyhow despite of Haejin labelling this correction as ABCDE i think we can also view it as a ABC correction shown below and C wave to end somewhere around $7050-$7190
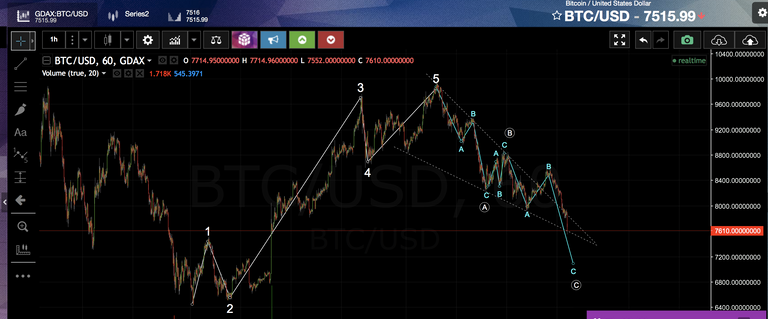
That's what I'm seeing too. Just a deeper retracement. Hopefully, BTC bounces off the lower trend line.
ABCDE correction on the way !
Then you think it's going down further after the ABCDE correction. Correct?
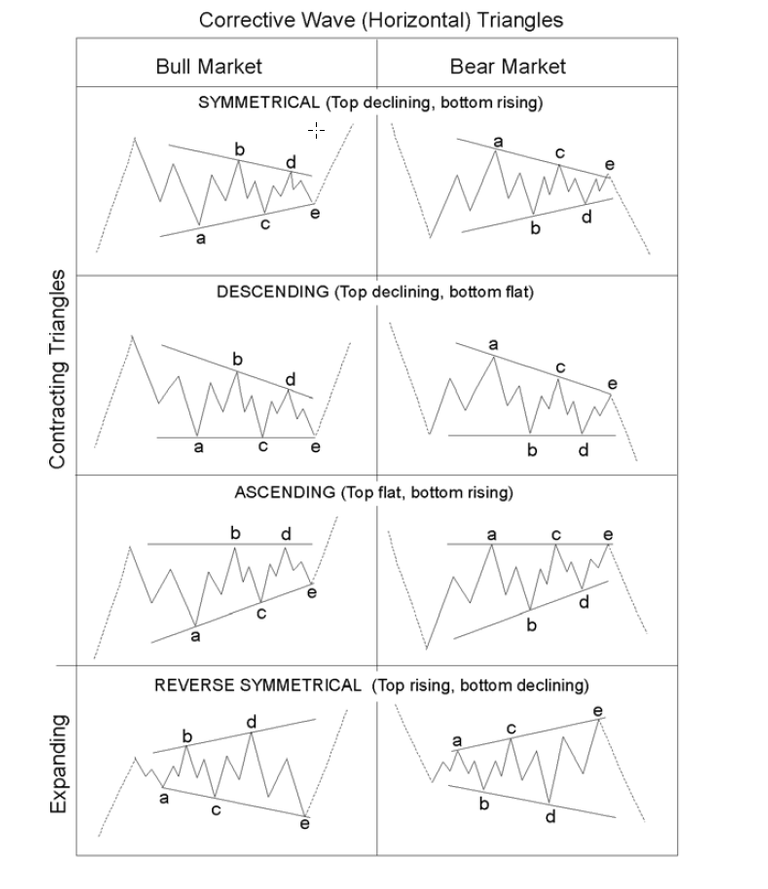
Because your corrective symmetrical triangle is labeled as if it's in a Bear market.
Bitcoin is in a bear market. It has been since it topped at $19,891 and has been grinding down ever since. Or has nobody noticed after all this time?
Thank you for sharing your posting
Have a great day~
Just like you predicted. I see BTC hitting 0.786 before making impulse up. Your thoughts, Mr. Lee??
I agree, definitely a possibility.
Not panicking, ready for the next buy, 786ish.......thanx for the update!!
It's always best to prepare for the worst. Isn't it?
It seems like bitcoin is coming down again
u r really great,, thnkzz for this post
Usted es lo mejor en publicaciones... es mi IDOLO...
PERO QUE PIENSAS DEL PETRO VENEZOLANO?
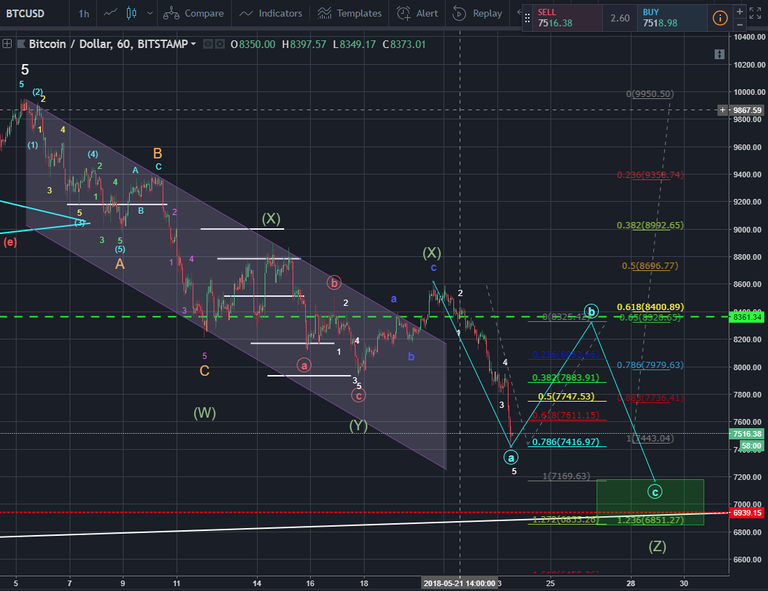
Unfortunately, I think we saw a wave failure last night and are in a Triple Zig Zag and we will see a deeper retracement of the white wave 1 which has been characteristic of Bitcoin as of late.
Update Tron please...
Hello. Your post has been approved by me.
I just downvoted the comment by @crypto-france
@crypto-france - You clearly realize that "post has been" is considered to be spam since I've replied to you 14 times before so I just gave your comment a 14% downvote*.
@haejin - You can remove this comment and everyone can whitelist me from appearing in future posts.
*If you continue posting in this way, I will continue flagging and the weight of my downvote will increase each time I reply until you stop. Please reply if my algorithm is mistaken.
Haejin, stop spamming! Use your brain to create good content! How can you spam about cryptocurrency 100 times per day??? People like you destroy Steemit!
Message to people who upvote this bullshit:
You can vote for BETTER and MORE earning (if you upvote only for curration rewards) CONTENT! Please, don't support junk posts!
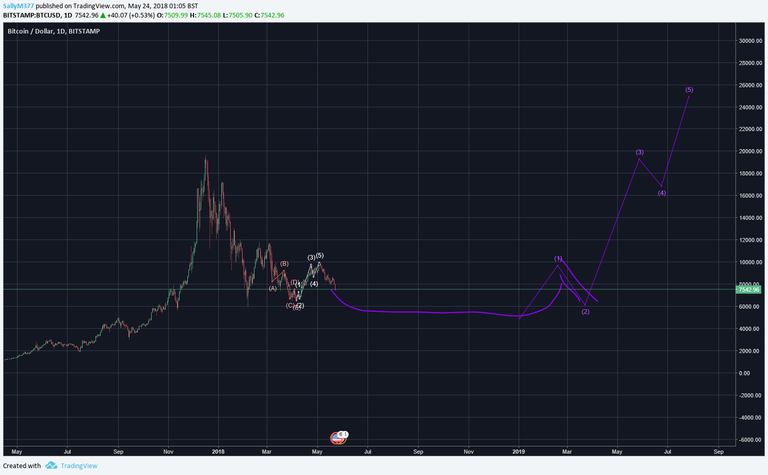
I know everyone wants the market to run up again, but what do you think of this alternate count? Another run up just looks way to soon when you pull out to the day chart. What if we are looking at the bear for the rest of this year?