is it possible? in some timeframes and some occasions, YES.
and right now I believe is one of them.
Time frame: Multi time; Daily and Weekly
today is the last day of the week, so next day and week candle opens at the same time. so let's look at the daily candle of bitcoin right now. but we keep a bit of chart's context as well. it's not ONLY based on one single candle, still we keep is simple:
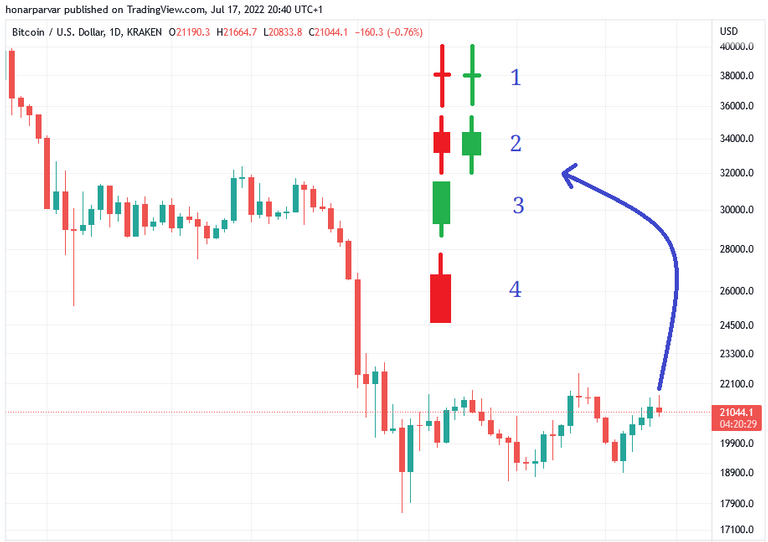
So that's the last candle of daily chart of BTC
the context: a trading range after a sharp fall.
based on being on the top of the range, it's a sell signal; based on sharp fall before the range, it's a worse sell signal! but based on the last bottom we had in the range, the July's 13th green candle was a very good bullish signal.
the binary analysis:
if today's candle ends like:
1: Neutral, so the rise will continue. target: $22800
2: Neutral; green a bit stronger bull, red a bit stronger bear. but rise will continue.
target: $21800 - 23300
3: Strong bull. target: $26K and more
4: Strong bear (sell). target: $18600 to 14500
why this candle can be more important than last few days' ones?
the weekly candle right now is slightly bullish. a bullish daily candle pushes it to a strong bull candle and can bring the hope for a major trend reversal in Bitcoin's prices.
my guess: I'm slightly bullish on BTC at the moment and I think it will break the current trading range. let's see ;)