
Today has been a productive day, i have already published 4 charts with this being the 5th one.
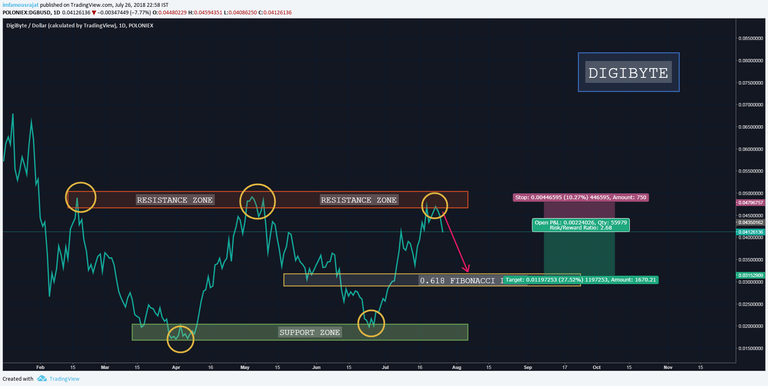
A triple top has formed on the DGB-USD and the price will start falling soon. The price got rejected from the previous peak level.
PATTERN: TRIPLE TOP
TIME FRAME: DAILY
RISK/REWARD RATIO: 2.68
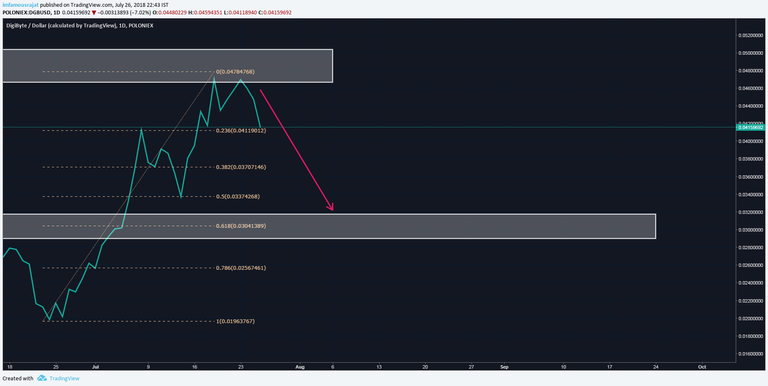
Below is the complete Fibonacci representation. I am expecting a fall to at least 0.618 Fibonacci level(but it may fall a bit more or a bit less too).
I have analysed the indicators and they are all supporting this decline.
Let's have a look at them.
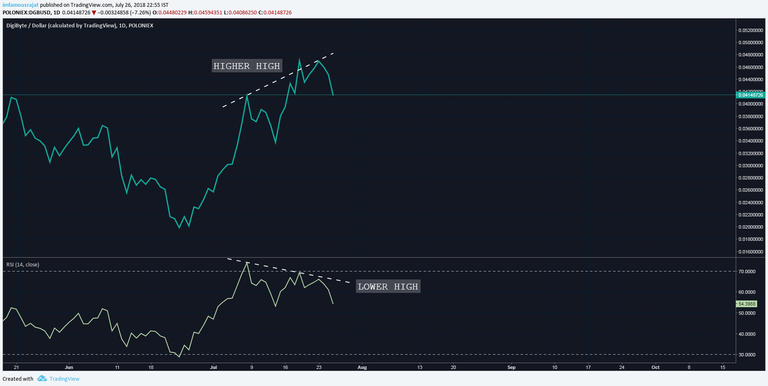
RSI
The RSI is showing Bearish divergence with the price forming Higher High but the RSI forming Lower High.
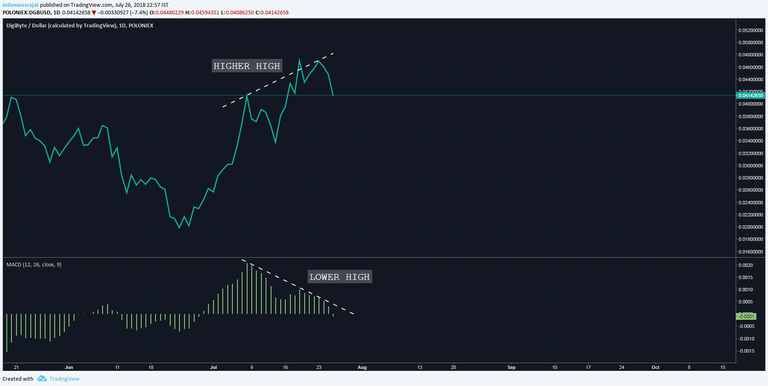
MACD HISTOGRAM
MACD is also showing Bearish divergence with the price forming Higher High but the histogram forming Lower High.
MOMENTUM
Also with RSI and MACD , the momentum indicator is also supporting the fall. There is a Bearish divergence between the price and the momentum with the price forming Higher High but the histogram forming Lower High.
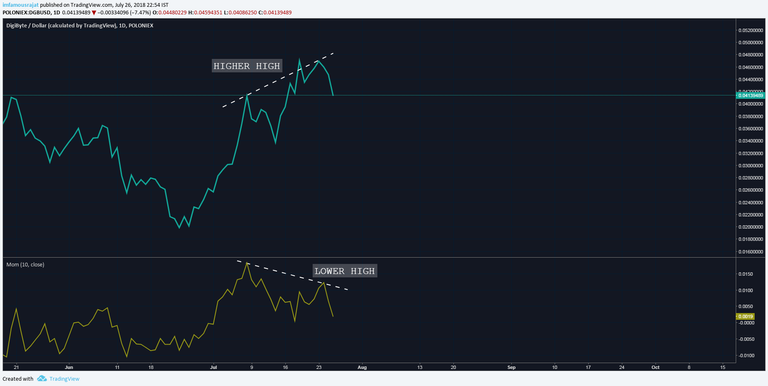
Trend is expected to reverse soon, from uptrend to downtrend. This may be a good time to close out longs.
P.S: This is not an investment advice. This is for learning purposes only. This is my personal journal. Invest your capital at your own risk.
Keep an eye out. Trade safely. Always remember, money not lost is also a profit.
Good luck trading.!
Peace.
Hi! I am a robot. I just upvoted you! I found similar content that readers might be interested in:
https://www.learningmarkets.com/how-to-trade-bullish-and-bearish-technical-divergences/
Congratulations @imfamousrajat! You have completed the following achievement on Steemit and have been rewarded with new badge(s) :
Click on the badge to view your Board of Honor.
If you no longer want to receive notifications, reply to this comment with the word
STOP