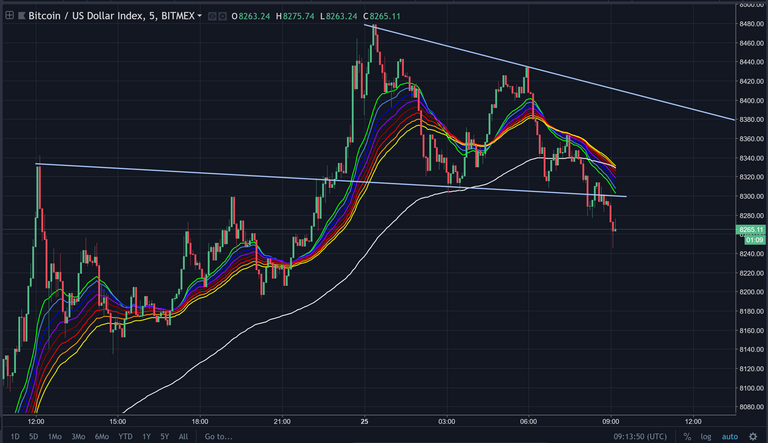
This is a 5 min chart but here we start to see a turning around of the moving averages.
We can also see that where we have previously been forming bull flags that have carried us up this recent rally we now have a break of that pattern.
Disclaimer: This information is to record and preserve on chain my observations of this technical analysis system, I do not advise making trades with real money from this information. You may lose your shirt or other spurious items of clothing with a possibility of starvation and death if you trade this information.