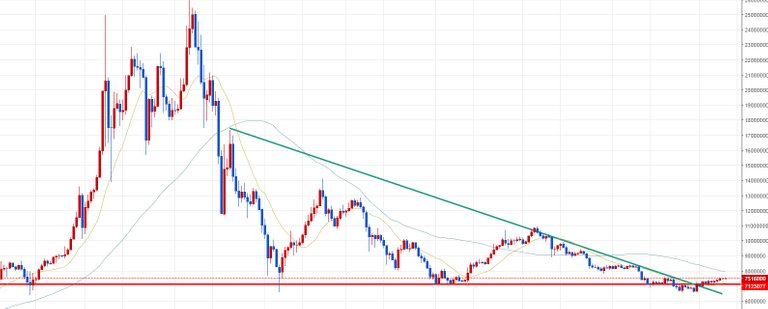
- 1day candle chart
Yesterday and the chart are not volatile. It is keeping the bottom of triple.
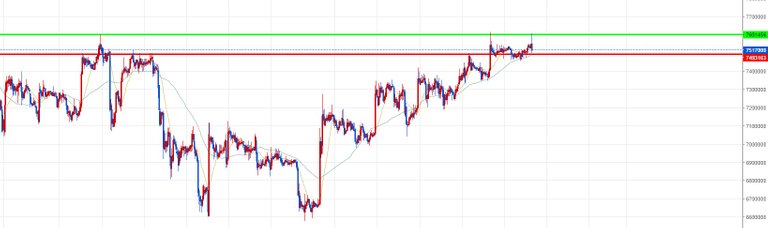
- 1hour candle chart
The two top point formed at the previous resistance point.
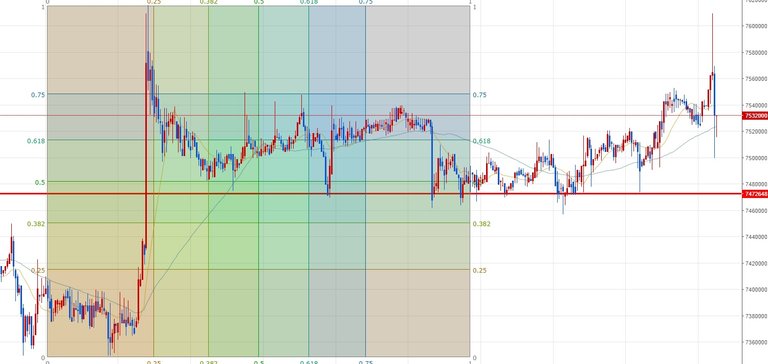
- 10minute candle chart
Rebound at the previous resistance point. Fibonacci rebounded at 50%.
** Disclaimer: This post is a personal idea, not an investment idea. The transaction is a small transaction, so please enjoy it. It is your responsibility to invest, and you should be aware of subjective judgments and technical analysis to make investments.