EDIT: TARGET NAILED $7,955 CANDLE BODY LOW AND $7545 WICK BOTTOM!!!! BUY TARGET WAS $7,810!!!!!
Hi everyone!
Thanks for checking out my TA on Bitcoin. This is using Bitcoin BTCUSD pairing on Coinbase.
Two days ago I was revising my trendlines on BTC and was trying to understand the Elliot Wave count for this correction. Many analyst at first believed BTC was completing a standard ABC correction early on. This was wrong, BTC was unable to produce an impulse wave and break out of its downtrend. Even after hitting a low of $9,000 USD, BTC did not have the volume to break out. What we can see in my post is that BTC has been wedging into a descending BULLISH triangle. Correcting to the 0.618 Fibonnaci region and where I believe, we will hold support and bounce off from to finish this correction. As we get closer to the APEX of the triangle, it is expected to have an impulse leg up towards the next wave cycle.
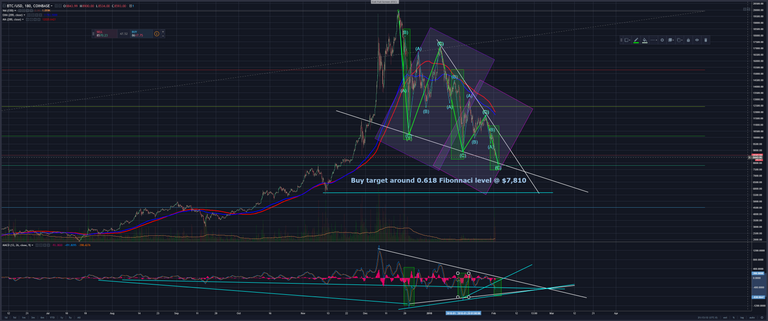
So where are we heading from here? Currently it's, 8:30 PM PST and I believe we have a few more days until BTC hits the target region. In the post below you can see the triangle forming. Instead of an ABC correction, I believe bitcoin is doing an ABCDE 3-3-3-3-3 triangle correction. Within each wave is a sub wave of a, b, and c.
We may use this image as an example: 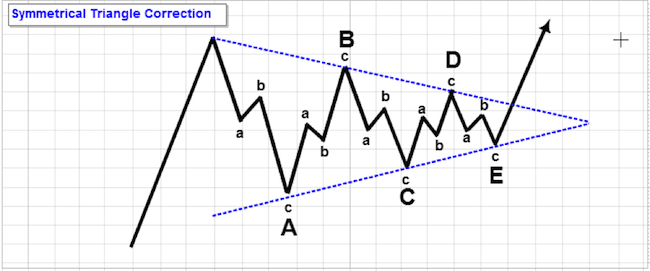
With this format I was able to count the individual subwaves in the ABCDE triangle. This is when I began to notice the fractals forming throughout the pattern. Highlighted by the purple box you can see the larger Head and Shoulders Fractal and highlighted by the pink box is the smaller fractal forming now. Before the quick downtrend within the past 24 hours I noticed each time BTC reached subwave B heading into C, there was a fast and steep downtrend, which some may consider a crash. This was confirmed today as soon as we reached subwave B of the fractal in the pink box. Highlighted in green you can see this trend repeat 3 times originating with the original A-B-C subwaves leading into point A.
With all of this and the trajectory of the final C subwave, I believe we are heading to the 0.618 Fib region targeting $7,810. It is possible that we go past that even to the $7.6K region, but I believe there is strong enough support in that region that any drop will be shot right up.
Lastly, the reason why I have confidence in the market is by looking at the MACD on a timeframe lower than the 1 day. We can see the wedge of higher lows forming on the MACD. We can see it reaching an apex. Highlighted by the green boxes are each of the break down points of the B subwaves. Each of those create a new low, yet they are becoming higher and higher each time. This indicates, selling pressure is dying and we will start trending in upwards with bullish momentum.
Thank you for taking the time to consider my opinion of BTCUSD on Coinbase, if you would like more TA post please UPVOTE and RESTEEM!!
Disclaimer:
I am not a financial adviser so please consider this as an idea. All decisions should be made with confidence in the self.