It is time of rising.
Yesterday Bitcoin Reached Our Forecast , and its price dropped.
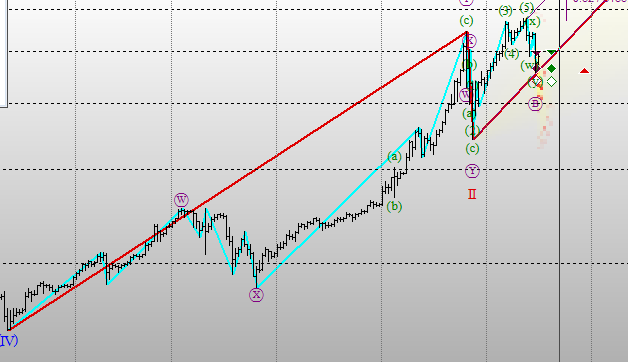
Now in long term Bitcoin Siganls Positive , Lets See Charts.
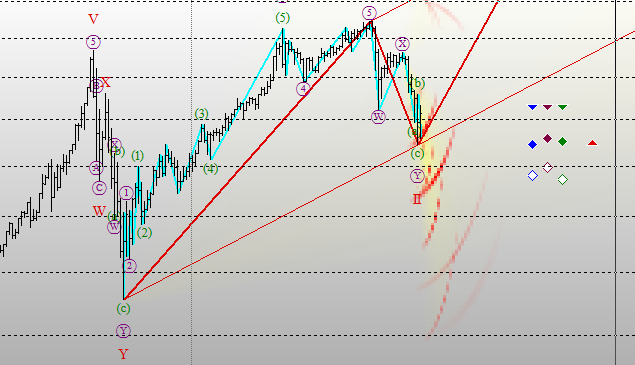
Daily Chart:
in Long term , First Target is ~ $2600 , but we need Shorter Term , so lets see next charts.
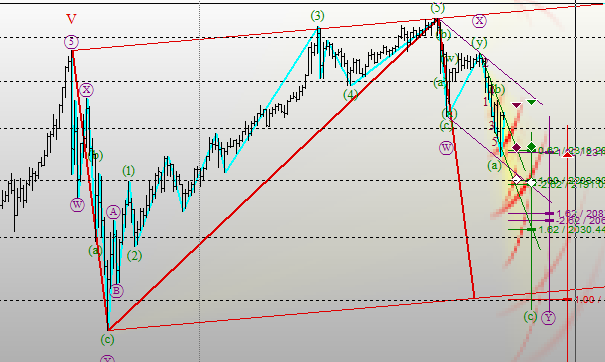
30 Minute Chart:
Bitcoin Will Go up , But maybe after another drop.

As you can see , second Point (c) Could Go lower.
Another Alternative :

and Another low probability Alternative about going down :

bitcoin will go up , but not now. it goes down.
[Important] price base : btc-e.com
note : if you like my posts , please support it by resteeming, tnx all.
*use this data on your own risk.
**please let me know if you want another cryptocoins Analysis.
I like this. Bitcoin has to go back up. Remember a couple months ago it dropped down to 900. I imagined it would go lower, but it shot up to a new ath. When bitcoin becomes worth tens or hundreds of thousands of dollars, I don't expect it to fluctuate by 100 or 200 dollars. I expect people to be able to hop at a 10 or 30 thousand dollar dip and watch their money pile up...in a perfect world I guess. One can stay hopeful.
Unlike stocks and other fiat currencies, cryptos are probably the only thing that technical indicators will work because it is not manipulated (fingers crossed).
Thanks for the analysis. Upvoted resteemed and following
thank you too :)
might there be a possibility that it will drop and then stagnate as it evaporates into the other coins?
i think no, not now.
bitcoin supported by china,.... and i think it will stay strong.
but everything is possible , chart is not all part of the market.
We should be bottoming from today through the 18th. After the 20th, we start heading back up toward new highs. < == not trading advice.