
TA from a trusted analyst (not me).
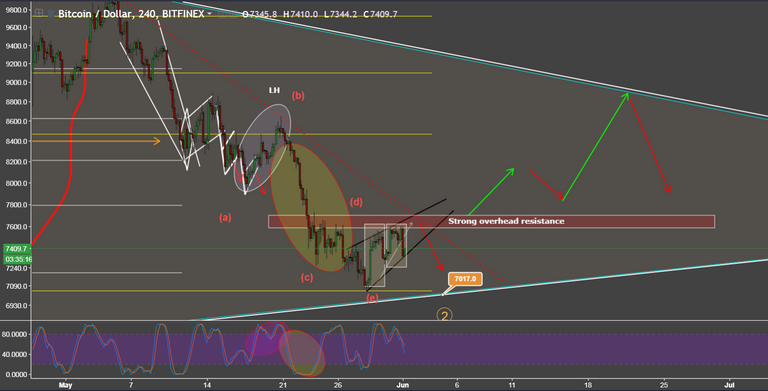
Our first chart is BTC on the 4h time frame. Yesterday I floated the idea of the ellipses drawn above and those playing out the way I've highlighted as the Stoch RSI is also in sync with bearish conditions. We are experiencing the same Stoch RSI movement now. On top of that we've got a rising wedge (bearish). I've created the strong resistance zone above with a long red rectangle as well as meeting channel resistance drawn by dotted red line. Getting above that and holding successfully can qualify as short-term bullish. Being under that and playing out the rising wedge is immediate term bearish. I've made arrows to show potential movement of BTC. There are also rectangular fractals that show an almost mimicked, robotic movement. I expect the fractals to get smaller but play out the same way into the rising wedge. Given the overall bearish climate of BTC I'd give a 70% likelihood of this rising wedge breaking down.
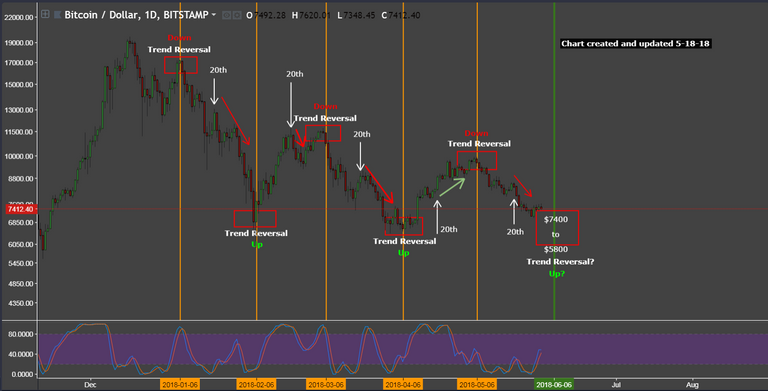
More and more people seem to have been catching onto the 6th theory that we found well before the crowd. However, just to reiterate, we are not blindly following this theory. It is merely augmented into our other analyses of BTC and crypto. With that being said, we are still on track for the June 6th reversal. This does not mean we will buy on the 6th but rather see if we hit a true bottom and we confirm a reversal.
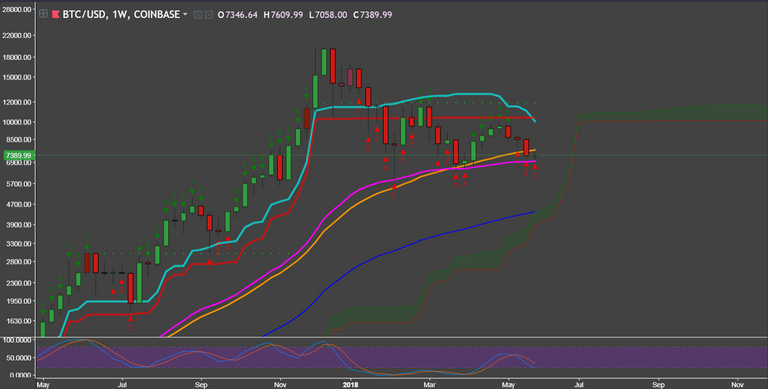
This chart looks wildly bearish. The most obvious sign to me is breaking under the 50 MA (gold line). This has not been done since maybe early 2013. However the current candle shows a doji. This is typically an indecision and a strong fight between the bulls and bears to stop the price from moving in either direction. Another bearish sign is the TK cross. The kijun line (red) crossing above the tenkan line (light blue) is a bearish sign. This could further indicate price breaking down for weeks or potentially months ahead. The 64 EMA (pink) is currently the only thing holding us up. The next strong MA I see is the 100 MA (blue) which currently resides in the mid $4000 range. Even the Stoch RSI has curled down with substantial room to fall.
Again, I am not bearish nor bullish. I simply convey to you what the charts show to me. My job is to empower you with information that can augment your research and provide you with optics of the overall picture. I will always do my best to either make you money or at the very least save you from losing money. Just remember that in markets, not being in a position is still having a position. It is totally fine to step out of the market and wait for stronger bullish momentum.
I remain short-term bullish (few days/week) and long-term bearish (weeks/months) until proven otherwise.
Resteemed by @resteembot! Good Luck!
Check @resteembot's introduction post or the other great posts I already resteemed.
Congratulations! This post has been upvoted from the communal account, @minnowsupport, by quantalysus from the Minnow Support Project. It's a witness project run by aggroed, ausbitbank, teamsteem, theprophet0, someguy123, neoxian, followbtcnews, and netuoso. The goal is to help Steemit grow by supporting Minnows. Please find us at the Peace, Abundance, and Liberty Network (PALnet) Discord Channel. It's a completely public and open space to all members of the Steemit community who voluntarily choose to be there.
If you would like to delegate to the Minnow Support Project you can do so by clicking on the following links: 50SP, 100SP, 250SP, 500SP, 1000SP, 5000SP.
Be sure to leave at least 50SP undelegated on your account.