Three weeks ago I posted,
If this rally is for real, the buyers must take out the remaining sellers at $900 and the next level above at $960. If price can get pass the $960 level, there is nothing stopping price until it hits the sellers at $1150.
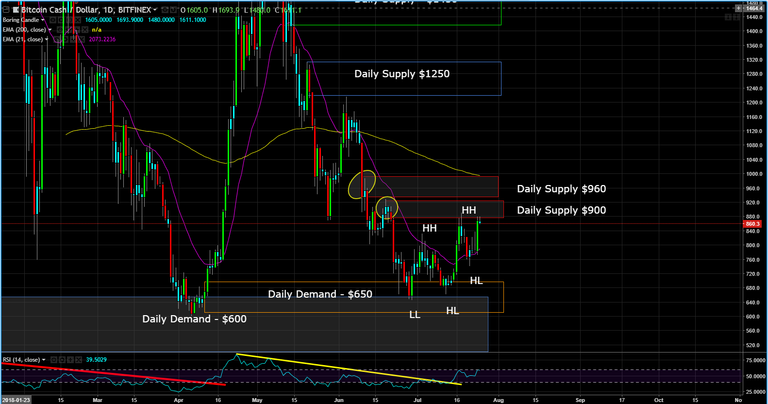
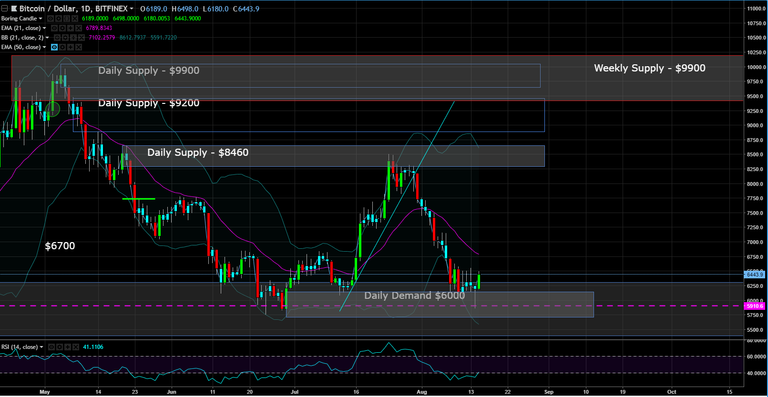
Well, ever since the SEC didn't approve the Winklevoss Twins Bticoin ETF in mid July, this was the catalyst that began the next decent down in the crypto space. And while Bitcoin is holding the key $6000 level,
the altcoins have gone down significantly, relative to Bitcoin. This includes Bitcoin Cash as well after making higher highs and higher lows, the sellers took control near the $900 level and push the price below the daily demand at $650 and $600.
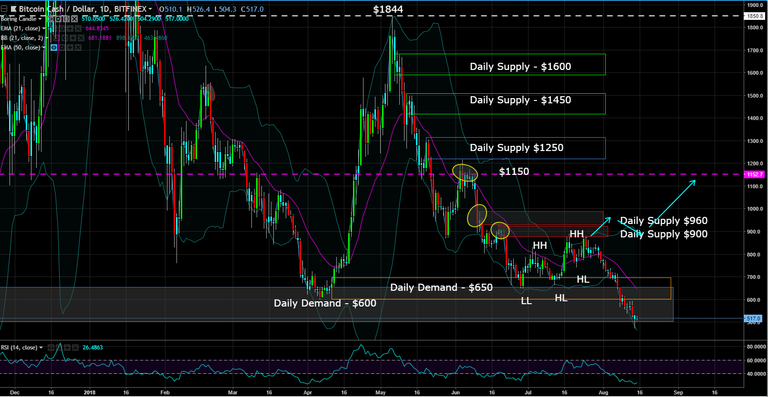
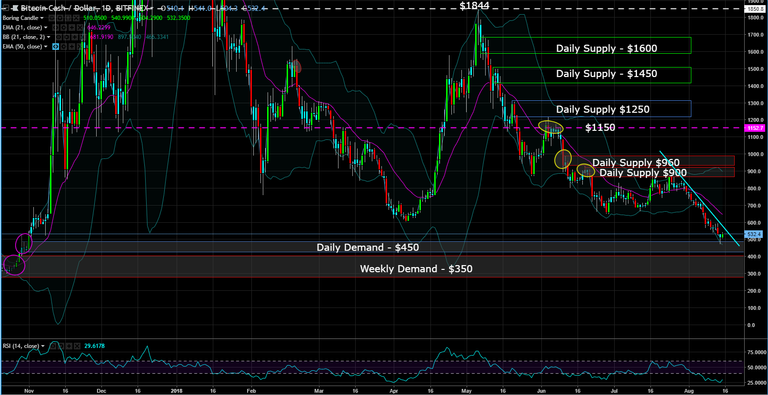
Since price has broken both daily demand zones, the chart suggest price is going down to at least the daily demand zone of $450.
NOTE: price has already hit the daily demand zone at $470, but until price can break the down trend line, price will penetrate the zone further.
This post is my personal opinion. I’m not a financial advisor, this isn't financial advise. Do your own research before making investment decisions.

Published on

by rollandthomas
But if it goes higher it will be looking to break 550$ line
If price is going higher, price must break the trendline, take out the sellers at $600. An opportunity to buy is on a pull back, but then price must challenge the buyers at $600 and $705.
However, I think the better buy is a bit lower because it opens up the range and lower is a weekly demand zone.