Disclaimer: This is not meant as financial advice and is for entertainment purposes only.
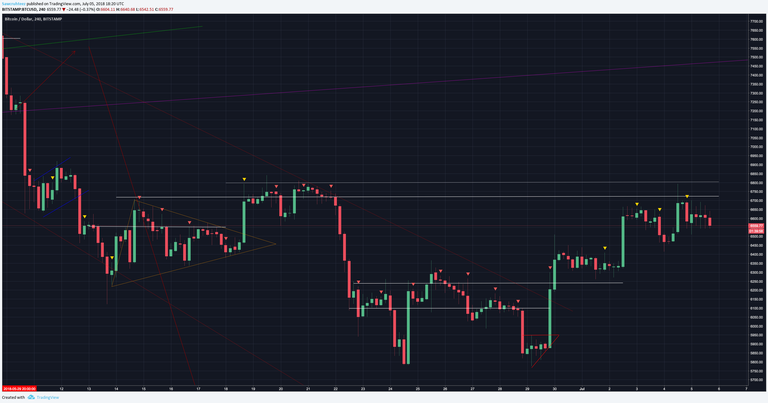
Yesterday we narrowed in on major areas of resistance and outlined why I believe $7,770 - $8,150 will be a great area to build a short. Since then we have shown weakness as the price failed to rally through $6,800. Today we will be checking to see if it still looks like the rally can get to $7,700+ as well as going over the reasons why I am staying out of the market while waiting for further development.
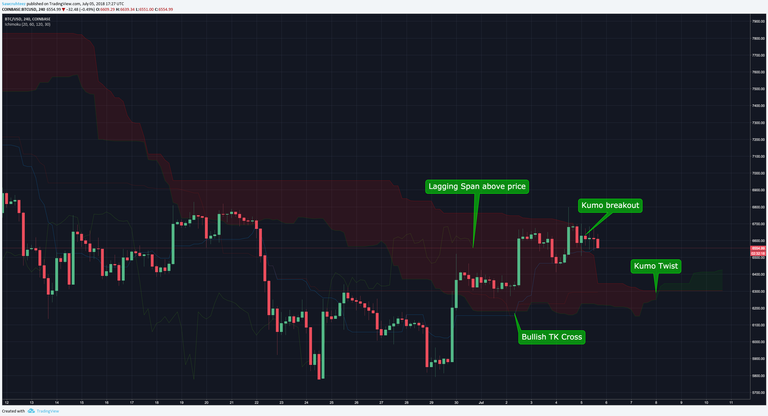
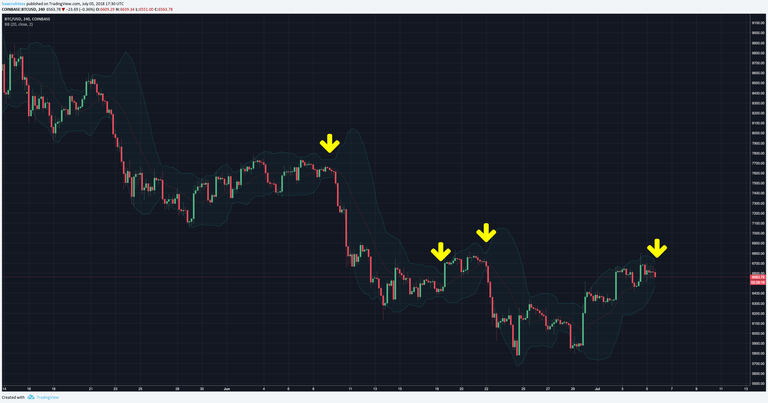
The Ichimoku Cloud on the 4 hour chart just had a kumo breakout, combined with a bullish TK cross and a bullish kumo twist.
Please note: I have not found the 4 hour cloud to be reliable enough to trade by itself, if that was on the daily chart I would open a long.
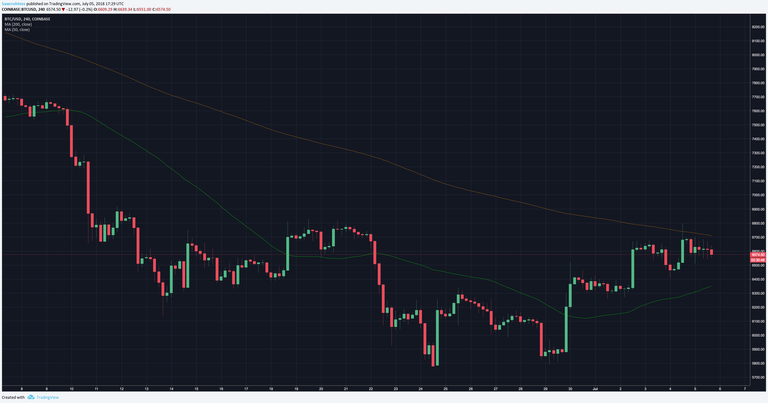
The 50 and 200 period MA’s on the 4 hour chart are posturing for a golden cross. The price is finding resistance at the 200 MA while the 50 MA postures upward. This is similar to what Bollinger Bands illustrate. The price getting squeezed in between the two MA’s before crossing over is a very bullish indicator for the short term (1-2 weeks). The last time those crossed on the 4 hour chart was 4/18.
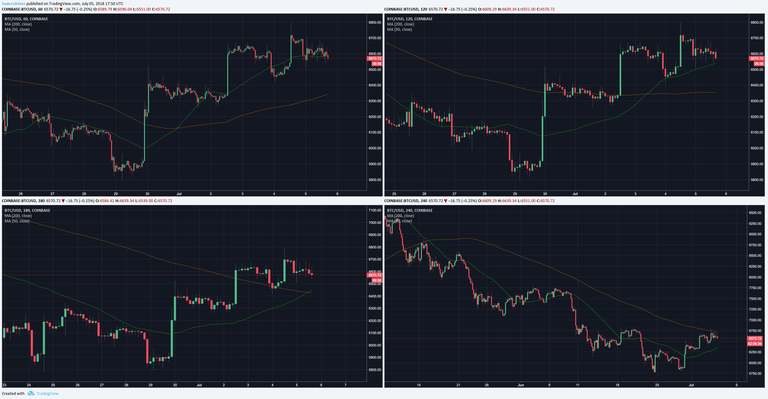
Before the moving averages can cross on higher time frames they must first do so on lower time frames. Therefore we would expect the 1 hour, 2 hour and 3 hour charts to crossover before the 4 hour. As you can see below the shorter time frames have already fallen in line.
The Bollinger Band on the 4 hour chart is starting to tighten and indicates that some volatility is on the horizon.
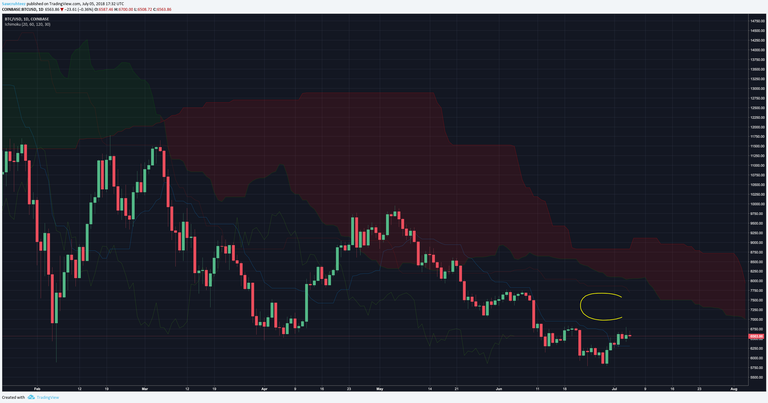
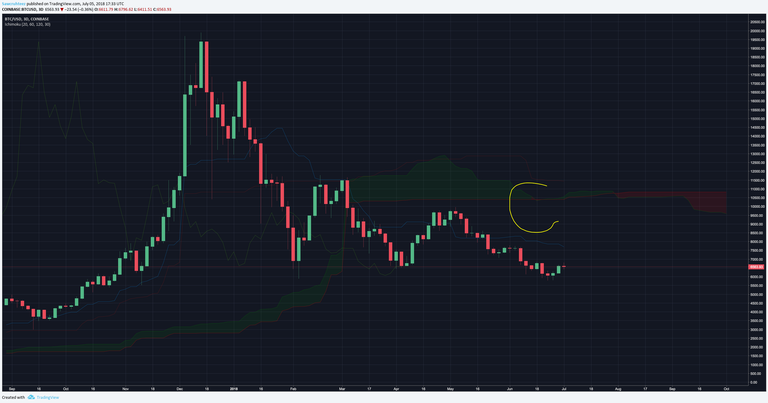
The Ichimoku Cloud on the 1 day and the 3 day are indicating oversold conditions and suggest that a return to equilibrium is imminent. That is due to the C-Clamp that is evident on the 3 day and widening on the daily.
With so many bullish indicators it can be difficult to remain on the sidelines. I seriously considered opening a small long on the 4 hour golden cross and adding to it on the daily 12 & 26 EMA crossover that is expected.
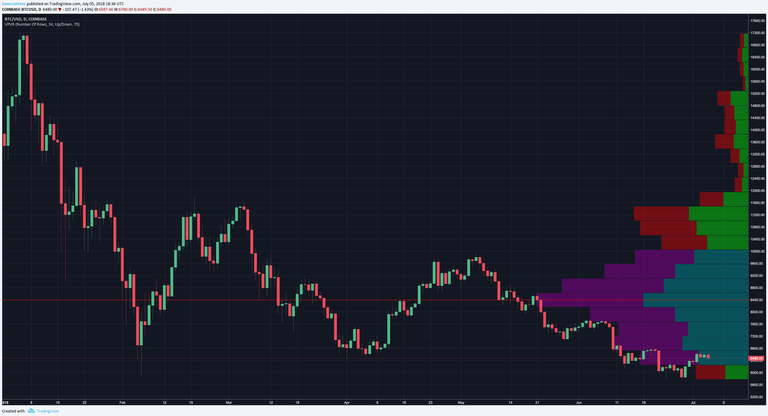
While I do believe that this rally has enough legs to get back to $7,770 - $8,150 there are two specific reasons that are making me hold off from opening a long. The first is the visible range volume profile which shows resistance stacked up from here to $8,500.
There are two basic rules to trading which apply here:
- Trade with the trend
- Buy support ($5,000) and sell resistance ($6,700 - $8,500)
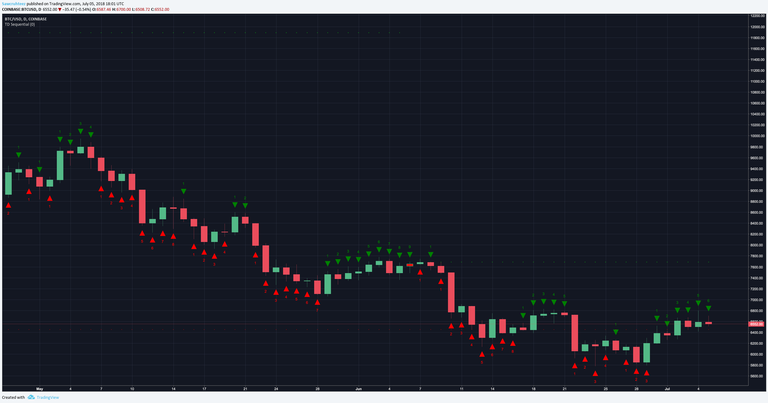
We are in a bear trend and we are under a ton of resistance. Therefore I am going to stay away from a long. The second reason which led me to this decision is the TD Sequential which is currently on a green 6 out of 9. That indicates that the entry was missed and this rally could coming to an end.
The best traders look for reasons to stay out of the market opposed to looking for any reason to enter. If you feel compelled to trade amidst uncertainty then you will get rekt! Learn to enjoy your time away from the markets as much (if not more) than you enjoy being in a large position.
Thank you for your time! Have a question? Leave a comment! Smash the follow so that you don’t miss out on future updates and remember that clicking the like is good karma!

After content like that you know you want more!
Yesterday's Post - Day 129
Trading Challenge - Day 115
Weekly Gold Update - Week 15
School - Options 101: Limited Risk with Unlimited Reward | Intermediate Trading Strategy | White Paper Cliff Notes: AION | Intro to Indicators: Stochastic | Bitcoin Market Cycle
Need a break? Read some Poetry! - I Believe | Aliens | The Universe is a Hologram | Sunset