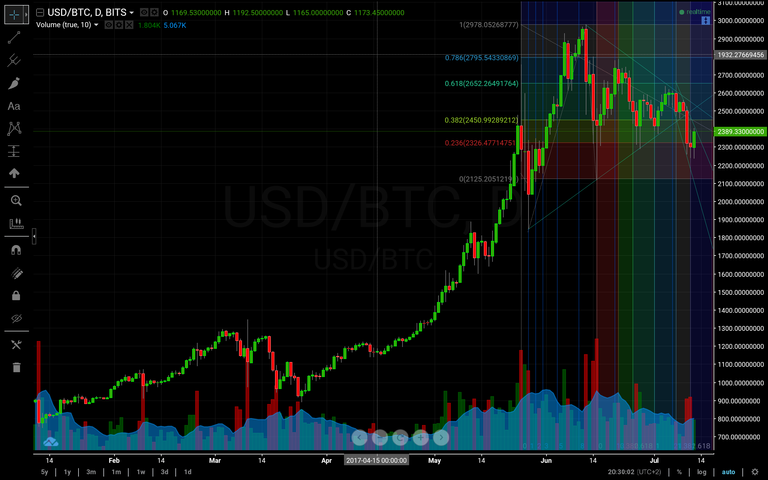
Our target is now below the currently drawn fibonacci in this chart. Probably around $1850 as mentioned many times before. We have seen BTC breaking out of it's triangle on the lower side, after a false breakout upwards. It has now crossed the 0.382 fib and has tested the 0.236.
Trend-based time zone indicates that we are going to reach a low on approximately the 17th. If the current trend is followed, we can expect this to be very reasonable and it could reach it a bit before.
Most of the indicators on the 1day chart show a continuation of the current trend and it seems likely that the rebound today is just a miniature bulltrap.
I get your idea @torjusg.
Try using the fibonacci without the transparent colors.It would be more clear.
Anyway nice work on the chart.
Thanks for the tip and the comment, I will try that. :)
Cheeky! :D