Here are a few chart pictures of the past years in times of a bear market.
Hier ein paar Chartbilder der vergangenen Jahre in Zeiten eines Bärenmarktes.
Linear Bitcoin Chart 2013

Linear Bitcoin Chart 2015

Linear Bitcoin Chart 2019

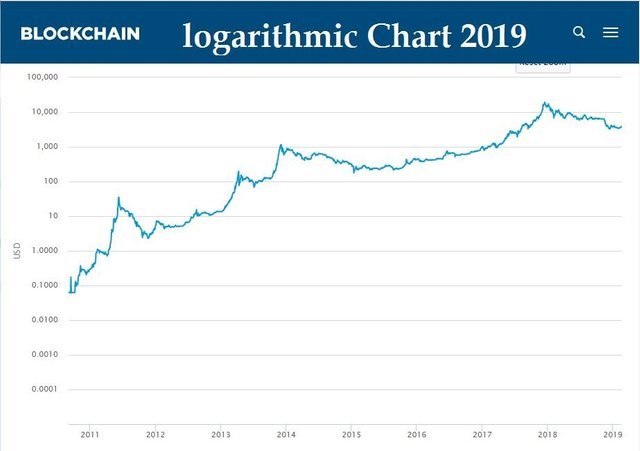
Logarithmic Bitcoin Chart 2019

Quelle : https://www.blockchain.com/de/charts/market-price
The path is clearly back to $10K support. Then boom rockets moon.
Question: Will that happen in 2019 or 2020?
Note 3 cycles demonstrate that trend/pattern/idea
maybe 5 cycles
Bin schon auf die nächste Blase gespannt ;-)
Ich freue mich eher auf die nächste Blase :)
Dann übernimmt VALIUM den Markt :-).
Ha Ha, geht mir nicht anders.
das würde ja bedeuten, dass der Bitcoin auf lange Zeit sich etwa auf etwas mehr als 10000$ etablieren wird.
I appreciate your post. Puts things in perspective, doesn't it?