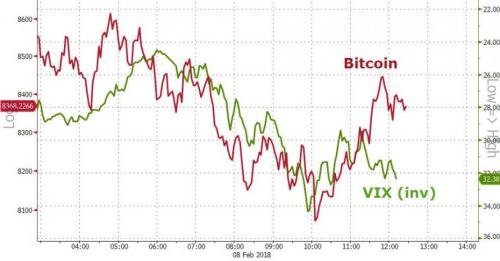
Potentially Q42018 for sure. However, if the stock market also tanks this year, it may take longer. The correlation with stocks is increasing:
https://www.cnbc.com/2018/02/08/bitcoins-correlation-with-stocks-jumps-to-2-year-high.html
I think it goes hand in hand with investor appetite for risky assests...and Bitcoin is one of the riskiest of all. Alternatively, people could see it as an alternative to stocks...but I'm not so sure of this.
Additionally, Bitcoin appears to be loosely correlated to the VIX (inverse).

source: https://www.zerohedge.com/news/2018-02-08/extreme-fear-strikes-stocks-credit-crashes-10-month-wides
How can you show a meaningful correlation with a chart that shows a single day's data?
Good point....how about this?
http://www.businessinsider.com/bitcoin-price-wall-street-volatility-index-correlation-deutsche-bank-2018-1
The chart there is a bit better. Zerohedge has a bad habit of zooming in on charts and pulling the axes to make a link look stronger.