SUSHI/USDT Daily Chart
Sushi continues to ride along the 21 EMA (yellow) and is consistently making new local highs and lows. However, the trend strength is getting weaker: we have descending trading volume. Also, the RSI is not making higher highs as the price does; it's actually making lower ones - hence the bearish divergence. The RSI triangle should also be noted. The MACD is still above the signal line, but the Histogram gets weaker and weaker, amplifying the weakening trend.
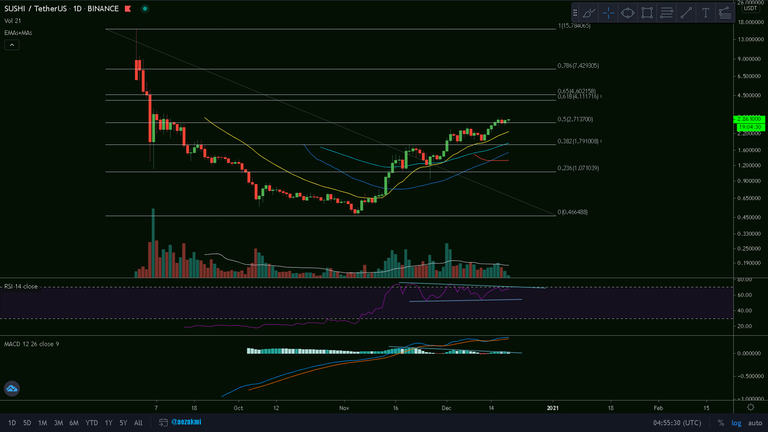
It's good to see that we've broken the 0.5 Fibonacci resistance level and flipped in into support. Staying at this level and as long as we are above the 21 EMA, we should be good. If we break the 0.5 and 21 EMA, we will probably revisit the 0.382, at $1.8.


Thanks for reading and safe trading!✌
If you find this post useful, please:
