What is a Technical analysis
Technical analysis is a trading tool employed to evaluate security's and attempt to forecast their future movement by analyzing statistics gathered from trading activity, such as price movement and volume. Technical analysts focus on charts of price movement and various analytical tools to evaluate a security's strength or weakness and forecast future price changes.

What are Indicators
Indicators are statistics used to measure current conditions as well as to forecast financial or economic trends. Economic indicators are statistical metrics used to measure the growth or contraction of the economy as a whole or sectors within the economy. Technical indicators are used extensively in technical analysis to predict changes in stock trends or price patterns in any traded asset.
Different kind of charts
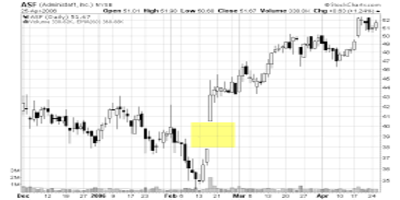
There are a couple different kind of charts. They all represent different information so its important to know which charts are usefull. Its also personal prefference which chart you youse. Personally i just love the candle sticks, but maybe its different for you.
The different charts:
- Line charts: Only show the closing price over a set period. More info
- Candlestick charts: This shows the opening and closing price over a set period. It also shows what the absolute high and low was of a candle in that period (recommended). More info
- Point and figure charts: This charts shows price movement without showing time or volume (not recommeded). More info
- Bar charts: Very similar to candlestick charts just what you personally like. More info
Different kind of patterns
If you know where to look you can see different kind of paterns in charts. These charts happen again and again so history keeps repeating itself. This way by studying these paterns you have a huge advantage. These don't happen 100% of the time, because this way everyone would be rich. Its more of an art then a science. The basic of patterns are a reversal and continuation. A reversal is when the direction of a chart changes and a continuation is when it just keeps going the same direction.
Patterns i will cover here:
- Head and shoulders
- Cup and handle
- Double tops and bottoms
- Triangles
- Gaps
Patterns Explained
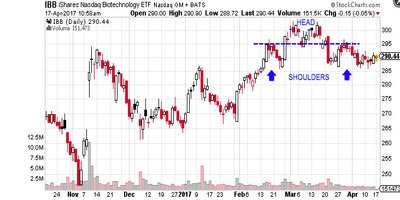
- Head and shoulders: In head and shoulders you are looking for three peaks with the middle peak being the highest one. The 2 other peaks being on the same level and lower then the highest peak. You connect these with a trendline this way you know the basic support level. Head and shoulders is a reversal chart pattern so you look for the breakdown.
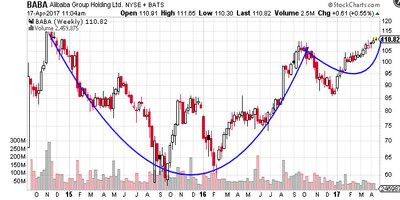
- Cup and handle: This is a continuation pattern of a bullish trend. Afther a small pause of the of the bullish pattern it will go back up in a U shape. Trying to explain it as simple as possible.
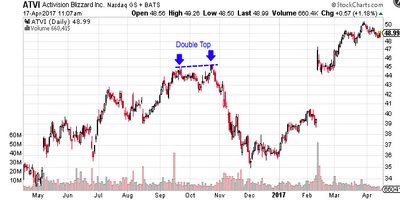
- Double tops and bottoms: This pattern is know to be very easy and reliable. If you see twice a top or bottom hitting the same resistance or support level without a breakout. This now signals a reversal of the trend.
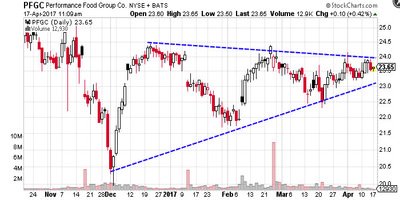
- Triangles: Triangles happen very offten but there are a bunch of different triangles you can look for. I'm going to point out which triangles there are. There are symmetrical triangles, ascending triangles and descending triangles. Symmetrical triangles occur when two trend lines converge toward each other and signal only that a breakout is likely to occur – not the direction. Ascending triangles are characterized by a flat upper trend line and a rising lower trend line and suggest a breakout higher is likely, while descending triangles have a flat lower trend line and a descending upper trend line that suggests a breakdown is likely to occur.
- Gap: Sometimes you see a gap in a chart. This is because when the market closes at a certain price and it opens back up at another price. This way their will be a gap in the chart. As example it closes a $4.00 but opens back up at $6.00 you will have a gap.
- Breakaway gap: This happens when a trend is starting to form.
- Runaway gap: This happens in the middle of a trend.
- Exhaustion gap: This happens at the end of a trend.
Different kind of indicators
I already explained what a indicator is earlier in the article, but lets dive deeper into this. I will explain my personal favourite indicators and how to use them. If you want to understand all the indicators you will need about 1 or 2 months (Or longer), because their are alot. What is important to know is that there are leading indicators they can be helpfull to predict where the price is going. Also there are lagging indicators these will help traders understand how strong a trend is.
Indicators
- MacD (Moving avergae convergence divergence)
- RSI (Relative strength index)
- CCI (Commodity channel index)
- Moving Average
- ADI ( Average Directional Index)
If you know the abbreviations you should be good.
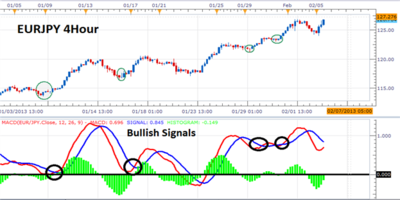
- Macd: This indicator is helpfull to know if you are in bullish territory or in bearisch terrtory. If you look at the bottom of the picture above you can see a blue and a red line. If the red line is above the blue line this means its bullish territory and the other way around. So you have to be on the look out for those cross over, because then a trend might reverse.
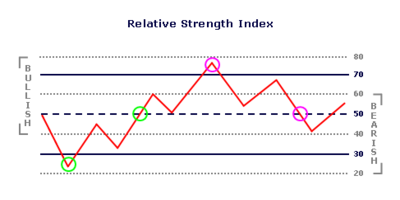
- RSI: This indicator will help you determine when to sell and when to buy. If you look at the chart above you will see lines on the 30 and 70. If the RSI is inbetween this i don't pay alot of attention to it. Only when the RSI is above 70 it shows that something is really overbought so you should sell. And when the RSI is underneath 30 something is really oversold so you should buy.
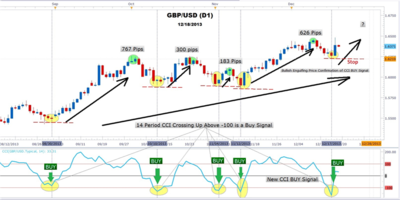
- CCI: This indicator is similar to the purpose of the RSI. You can see in the picture below if the CCI drops you buy if it goes up you sell. You can use both the RSI and CCI together for comformation of the trade.If they both show the same thing there is a better change it will happen. Simple logic.

- Moving average: This is really well explained in the video above. I suggest you check that out. Moving average just smooths out the price action. Simple as that but really helpfull.
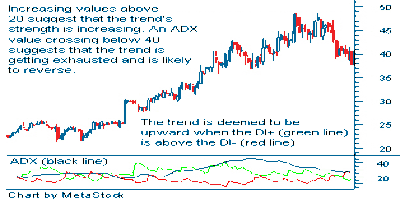
- ADI: With this indicator you can see how strong a trend is. So if there is an uptrend and the ADI is at 50 you know this is a strong trend and has a big change to keep that trend going. And if there is an uptrend and the ADI is at 10 you know this is a weak trend. This will probably reverse.
Conclusion
I hope you learned something from this article. The conclusion is the more you learn about this the greater your changes of making money. This is just to get you started and my knowelgde. But there is alot that i don't know. This is because i am still learning and i would love some help with that. If i made any mistakes you can always point that out in the comments. If i didn't u can also point that out.
Alot of information i got is from investopdia. So i highly recommend u check that site out if your interested in this.
Disclaimer: Most these pictures aren't from me
Author: #Bartcardi
if u need any help with it or if you have a good question or business proposal for me. Find me on discord under the name Bartcardi
A follow, comment, upvote and resteem rare highly appreciated!
My account is still pretty small so i can use all the support i can get!
Check out my next post: https://steemit.com/money/@bartcardi/technical-analysis-and-on-steem-for-the-long-run-pricepredcition-bartcardi (TA on steem)

you should run a chart on steem and sbd price, thanks for this article its enlightening ill share with my noob friends so they could learn from this aswell, analyzing price charts and understanding trading terms can be rather daunting, especially for the beginners but you made it so simple thank u.
Great tutorial! Easy to understand and practical. I try to share my knowledge and learn at the same time. I do Elliott waves and chart pattern analysis. I've made several analyses on both Steem and SBD that you should check out. Also just posted a new gem about Golem.
GOLEM (GNT) - Analysis (572% POTENTIAL PROFIT) https://steemit.com/cryptocurrency/@benkalashnikov/golem-gnt-analysis-572-potential-profit
https://steemit.com/money/@bartcardi/technical-analysis-and-on-steem-for-the-long-run-pricepredcition-bartcardi Made a simple and easy steem TA!
Upvote nd follow me
Upvote nd follow me
Thankyou very much and do a TA on steem and sbd u mean?
That would be great!
Just made one mate
yes definitely
yes of course
wow..this is my first time here..how do this stuff run
Just made one mate!
me also first experience
True
https://steemit.com/steemit/@noganoo/all-of-the-top-ranked-users-claiming-to-care-about-the-steemit-are-the-same-ones-who-allowed-the-platform-to-be-abused-early-on
Simplest explaination I have found yet, and on Steemit none the less.
i also found this is great and i feel happy about this
awesome post my steemit friend good wish you good luk thank you very much
It's all nice, but technical is not enough
yes but we found nice
@dreamchasser would you mind taking a look at any of my post and telling e what I need to improve on to make a living from Steemit?
true absolutely
Thanks for the info 🙏.Aprreciate the lesson
good one..,
Excellent article. Very interesting to read. I really love to read such a nice article. Thanks! keep rocking.
thank u.
Agree the explanation really helped me understand the jargon thrown around. Video confused me a bit, though.
Can you suggest any software we can use to chart these things on our own?
@dreamchasser @bartcardi
That's a good post with all the essential tools to understand a graphic but.. on this world, I mean.. in crypto is much, much, much important to know where and why are you investing on the selected project.
TA stays in a second layer after the first research about project is done. When we decided that the project is good and it has potential then.. it's time to look at the graphic, no before!
This crypto world it's a bit different from stocks and we are just at the beginning of this amazing technology birth and few data we have from the past to make a right TA for the long run.
We are all lucky to be here!! :)
(resteemit)
Good to point that out the fundamentals are ofcourse the first thing to look for. I will only do a TA if the fundamentals are there. Great comment!
I also see SMTs as the solution to the low earning woes on Steemit, because with multiple platforms distributing their own tokens, it will give people a variety of options to increase their overall earnings
yes..
Technical Analysis seems like voodoo to me. I know, it's more of an art than a science. Put the same paintbrush in my hands and in Van Gogh's hands and you'll come up with two entirely different results.
Hahahah nice comparison. But yea thats true you have to know what you see. Everything i learn i will share with the steemit community! So u might become that van Gogh because of me ;P
STEEM WILL MOON!
Whoever said TA doesn't work should start charting ;)
yes you are right
Well, my money is definitely on it mooning!
hmmmm
hahaha top comment STEEM WILL MOON!
Lets hope so my friend Lets hope so
🚀
Genius or crazy “steem will moon” top comment?
how much it harm the site we need to have a look on this
https://steemit.com/blog/@farazahmad/reality-of-sweetsssj-she-is-doing-fraud-part-2
I need whale support against this scam
what does it means??
Steem price will go very very very high, to the moon
OOF OOF OOF. Prrroooovvveeee it boyo
This article and this: https://steemit.com/cryptocurrency/@hami/perma-crypto-culture-review-of-how-the-permaculture-design-principles-can-be-applied-to-the-crypto-world
Are invaluable resources. For newbies and people who have been in the game for a while.
I definitely learned a lot! Thank you for sharing this detailed information. It encourages me to learn how to analyze charts more, which I don't do often.
Thankyou for the comment appreciate it alot from such a big account, would loveee a follow! Yeah but just takes alot of time thats why most people don't do it often.
Another tool I use... that is RVgI (Relative Vigor Index) and I think it's almost like RSI. Could you please suggest @bartcardi?
i also learned lot from there
Do you think we should hold LTC?
Hard to say it is a great replacment if bitcoin fails. Then LTC will have a large change to moon but will still compete with dash and BCC. And to take in cosideration that the owner of LTC sold all of his coins at $330 i wouldn't bet my money on ltc anymore
nice post ty
Important question- Have you considered a name change now that Bacardi has purchased Patron?
Bartcardion doesn't quite roll off the tongue though...
haha wasn't aware of that. Might have to change it then!
Thank you for your post it will help me to understand the crypto market
DISCLAIMER: dropahead Curation Team does not necessarily share opinions expressed in this article, but find author's effort and/or contribution deserves better reward and visibility.
to maximize your curation rewards!
with SteemConnect
12.5SP, 25SP, 50SP, 100SP, 250SP, 500SP, 1000SP
Do the above and we'll have more STEEM POWER to give YOU bigger rewards next time!
News from dropahead: How to give back to the dropahead Project in 15 seconds or less
How use it.
Hi, have you joined our discord chat server already? Please join there and send me a direct message: https://discord.io/dropahead
You have to send ME a direct message, RIGHT-Click my username, click option: "Message"
NOTE: All channels are blocked until you pass the quiz
Thanks for the breakdown! Very helpful!
Great one... resteemed
Great overview and guide for technical analysis. Checkout my recent analysis on steem bts and eos.
Will do mate thankyou for checking out my full profile!
Wow, @bartcardi, your article is most enlightening and extremely well written while containing graphs that really underline the thought processes presented along the way.
Thank you for all this education, it brought light to a subject I am hardly starting to delve into. Namaste :)
Gratefull for your reaction here! i hope i thought you something today. On steem you always learn new things. If u follow me u will learn alot more about this subject! Namaste ;P
Excelente información. De verdad muy útil!!
Thanks for sharing this @bartcardi. It's great to see someone explaining these concepts for beginners, I'm glad that you're helping other Steemians out!
Thanks for your comment. Will help out people where possible.
Great to hear. I'd really appreciate any feedback you have on my posts and growing my account, if you have any!
Cool
Would you recommend this strategy as well? I've been searching around for a great way to figure out these patterns but I never actually spoke to anyone about it.
Which strategy u talking about?
Great work man!
Super helpful introduction to technical analysis! Although I do want to mention that technical analysis does take more insight than noticing a "triangle shape" in the graph. I unfortunately learned this lesson the hard way lol
Yeah, that's more of a "boiled" down explanation. That's why I've never attempted it. I don't want to get burned!
Very true good to point that out. Most of us learn the hard way i guess. Thats a huge reason for this post
Man Bitcoin is tumbling again.
Things seem to be up and down lately. Day trading is the only place to find a profit for the last couple weeks.
What does that have to do with this article?
Not too much, just browsing steemit while I day trade a little bit.
haha okay mate good to have you on my post anyway :). making any profits with the day trading?
For me day trading always not profitable lost do much in day trading that's why now holding coins for long-term
Yup, made some nice scalps from the dip
Nice do u only day trade crypto?
Yes, day trade crypto only. I also invest, with a small stack for day trading.
it's in downtrend,it has to tumble
yes
I don't know how to thank you for sharing this piece here but you did a great job
How i said a upvote, follow and resteem would be great mate.
All done bro
Thankyouu
Technical analysis considering all aspects. Good post for people who dont have knowledge about trends and indications. Keep it up.
this stuff is like rocket science. thanks for making the huge effort to explain it all
Mate this took me like the whole day to write this so everyone can understand it.
One of the best articles I've seen on the basic indicators and alaysis. Even for a someone that has done this for years, I love seeing someone put together a resource that is so informative.
Keep it up. I'll be following you.
Means alot for me coming from someone that is doing it for years. Just got into it a couple months ago but trying to learn as fast as possible! Everything i learn i share on steemit so everyone can grow.
That is what I truly love about steemit, there is just so much great information and from so many diverse places and societies and view points. Everyday is a new adventure in education that is purely addictive.
Same same same. I couldn't tell it better. So much better then any other social media platform, because i actually learn things.
I would vote you higher but I'm out of ammunition for the day.
Basic concept of technical analysis is extremely well explained.keep up good work. Thanks for sharing
Thankyou sharing this is highly appreciated mate!
Well done man. I am an experienced trader but still enjoyed reading your post. Possibly next time when doing something like this, make sure you are clearly indicating which graph is showing which indicator etc. See you have a nice payout already, well deserved.
Okay great tip thankyou very usefull
Very interesting, thx!
Lots to think of. The more we think, the later for us to decide and in process, make things complicated.
that's awasome @bartcardi,
thankyou so much for sharing this.
nice to know your blog,
iam a biginer steemian
see you at
https://steemit.com/introduceyourself/@steemitilmu/introduce-yourself-1051fd8d2d835
Thanks so much for your effort in explaining this, I wish I could get to meet you someday.
If you are from the netherlands its always possible
Hey i jst upvote ur post can u plzz upvote my post plzzz I need soo much of support from all off u plzz upvote my post
Your post resteemed and upvoted by @yusifm
Send 0.05 SBD to @yusifm for an Resteem+upvote . Just your link in memo section with payment. Premium-send 1 sbd for unlimited resteem(30 day)Plz follow me
This is great info for those who are new to the space. If anyone is planing on trading any of the patterns shown above, I would also implore them to do some research on risk management and position sizing as well. A person I met in a trading group on Facebook has a great website (http://www.newtraderu.com/) that has tons of great info and suggested readings for new traders.
well and carefully delivered lecture. this post remind me of forex trade. as a forex trader then, my best trade pttern is the double top and bottom. it has a huge profit over many other patterns. and its win percentage is more than others. because, 1: its uses support and resistance to form it signal. and it usually form from a trending market to give a reversal. then for indicator, i like my chart very simple. so i only uses MA and STOC. .....though RSI can perform almost same as stochastic. one very important thing i will love you to talk about is candle stick formation. it will really help the newbie even some average trader as well. thank you. i am following you and i just up voted you.
Thanks😀
Very usefull for everyone, people should pay attention to this post.
For me TA is a way to plan the best entry and exit point. With some experience you can "predict" the way the market is going to turn. It is not really a prediction, it just identifying the first movement and follow the trend. Check my analysis out.
Nice comment will check it out
Thank you!!! It is a verry good article to learn a much about this!
Vote here and Get your last 4 posts voted by 5 users !
https://steemit.com/steemit/@black.alien/vote-here-and-get-your-last-4-posts-voted-by-5-users
You should try making a chart to compare steem and sbd price that will be very helpful..
Very good article. It definitely taught me something.
great post!
one thing im confused on, but maybe im wrong and you can point it out. but on the MACD you say that the blue line above the red is a bullish trend and red above blue is bearish. but if you look at the example you gave above, it shows the blue line above the red and the blue line dropping...so wouldnt that be a bearish trend for the blue lines? or am i missing something?
thanks
Owhh damnn good you pointed that out. I fixed it straight away. I always assume red with losing money so thats why wrote it that way. Thankyou very much my friend. Sharp eye worth a follow ;)
Resteemed to over 10300 followers and 100% upvoted. Thank you for using my service!
Send 0.100 Steem or 0.100 Steem Dollar and the URL in the memo to use the bot.
Read here how the bot from Berlin works.
We are happy to be part of the APPICS bounty program. APPICS is a new social community based on Steem. The presale was sold in 26 minutes. The ICO will start soon. You can get a account over our invite link: https://ico.appics.com/login?referral=1fRdrJIW
@resteem.bot
can I use your pictures to make a dummie version of this and I'll make sure I'll put your name with it
Pro Tips:
-Start Staking full increments of NEO within your Encrypted NEON Desktop Wallets to start Generating GAS as a Dividend.
-Stake KuCoin Shares (Minimum of 6 Shares) to build up a daily Return of KuCoin Exchange Fees split up amoungst all of the Alt Coins being traded on KuCoin Exchange.
-ICX, XLM, POE & LTC Looking good going into February.
Thank you for this very valuable info, this is a new space for everyone looking to get into crypto and posts like this go a long way!
Thanks for this post. Every bit of knowledge is extremely helpful
good!
It is wonderful to see such free information available for people to use and, not some scam. Thank you and keep up the great work. Steemit feels like a fresh of breath air for the new 2.0 - Internet. We're living pioneers
nice ant thats my Tattoos
Good One....
Everything is so much easier now :O! Thanks!