Ripple fundamental analysis. Reasons and results of XRP price moves during the recent year. Updated XRP trading scenario. Ripple key levels.
In this post, I applied fundamental analysis and some elements of technical analysis.
Dear friends,
Today, I’d like to dwell upon the XRP coin, or Ripple, mostly in fundamental terms. This coin arouses different comments. The last and the strongest hit on the cryptocurrency was delivered by a group of analysts at Bitmex Research, which released the results of their research on February 2018. (see here).
Now, it is not anymore a secret for anybody that Ripple is not a decentralized coin. And I won’t write much about this; I’ll only mention that its administration can freeze any XRP wallet without any changes in the blockchain network.
In addition, few know that, upon an agreement with the financial regulator, this company regularly audits and hands in all the internal transaction information, and so, Ripple can be neither called a privacy-based network.
I suppose, it is for the regulation and open audit, the Ripple Labs Inc company has found so many partners among the largest global financial institutions ( American Express, CIBS, UniCredit alone are enough).
Nevertheless, if XRP is a centralized, rather than a confidential cryptocurrency, it is surprising that it is still among the TOP coins by market cap. It is due to the constantly rising supply of the coin in the market.
Frankly speaking, I haven’t found any charts or open-sourced statistics on changes of XRP amount in free circulation; that is why, I had to follow the dynamics by myself by means of historical snapshots that are saved on coinmarketcap.com every week.

screenshoton 11.08.2013
As you see, open XRP supply in the market started with just 7818 billion XRP (screenshot dated 27.07.14).

Less than a year later, the supply was 0.5 billion XRP up (snapshot dated 31.08.2014).

However, a little more than a month later, XRP supply was over three times more, 28.989 billion XRP (screenshot dated 30.11.2014).

Three months later, there was another dump of coins in the market. Another 2 billion XRP was on sale (screenshot dated 22.02.2015).

Next, another high increase in supply occurred in February, 2015. (a billion XRP more).
After that, the number of coins, being sold, continued increasing, but the intervals became longer and the amounts were less.
Nevertheless, open sale of XRP in the market is now of 39.372 billion of coins. In addition, you know that total amount of XRP, possible within Ripple protocol, is 100 billion of tokens. It is important that these coins are already issued, and you don’t have to mine them, and so, the supply of the Ripple cryptocurrency will increase.
You may wonder where the rest of coins, which are not in the open market, are. Most of those coins are held by the Ripple Labs Inc founders. To comfort the market, and regain the trust in this crypto asset, the founders limited the XRP ability to be sold at intermediate rate during a few years.
As a result of the above notorious events, XRP is likely to be the most manipulated cryptocurrency among the top participants.

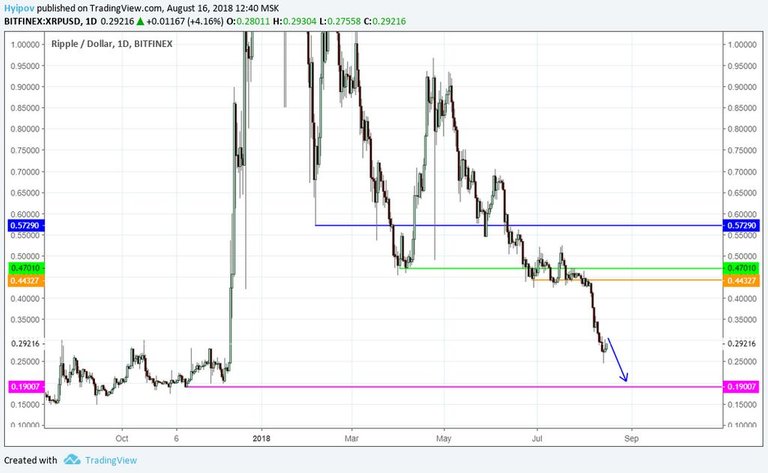
In the Ripple price chart above, you see how much Ripple surged just in a month, since December to January, by 1544%!
It is the fastest price rise among all cryptocurrencies. Now, Ripple price is 92.41% down from the last increase, which proves the lack of fundamental reasons for such a surge and directly suggests that the coin is manipulated.
It is not surprising that after such a crash, a part of investors filed a lawsuit against the company, charging it with manipulating XRP rate and deceiving investors.
Unfortunately for poor investors, the court found no reasons for a case and rejected the claim. Nevertheless, it is a precedent, and other investors may try to defend their interests in court. It can result in additional risks for XRP holders.
Summary:
“A fair face may hide a foul heart”, the proverb is obviously true for Ripple. Despite its impressive drawdown and imagined chance of the price retracement by over 1000%, I don’t think it makes any sense to buy this altcoin, according to fundamental analysis.

The Ripple price chart is evidence that hardly anybody supports XRP rate; moreover, Ripple developers are not interested in supporting the rate as well. They hold most of all issued XRP coins. Jed McCaleb, the former member of Ripple's Board of Directors, bothers even less, as he left with large amount of corporate coins.
XRP holders can count on nothing but the support at the lows of 2017, it is at 0.19 USD.

As clear from the Ripple price chart above, the asset’s volatility is too strong, which definitely makes XRPUSD more appealing for speculators. However, the large contracts of Ripple and financial giants are not surprising anymore and hardly affect the cryptocurrency rate.
So, when buying at the current levels, you can hope for nothing but the company management kindness and the wish to attract attention to the coin by means of explosive pump.
Well, let’s apply some elements of technical analysis to XRPUSD chart to see what Ripple price is promising in future.

In 4H XRPUSD price chart, you see the ticker is trying climb up from the bearish trading channel. However, taking into account the scale of the earlier sales and the market general weakness, it doesn’t succeed very well.
Finally, the most likely Ripple scenario for the next few days suggests consolidation at the current levels and a try to retest the key levels at 0.19 USD -0.20 USD.
I don’t yet see any strong buy signals.
That is my XRPUSD fundamental analysis. Go on following the rate and staying informed.
I wish you good luck and good profits!

why?
you don't speak english?