Market lows after a corrective move are rife with hopelessness and fear. But these are exactly the times when people should be buying. The only thing bearish about 2018 was the price - a significant amount of the accumulation of Bitcoin has been through large OTC (over-the-counter) 'block' transactions (generally a minimum of $250,000 worth of BTC per block). Do you think it's a coincidence or happenstance that the largest amount of institutional investment and capital ever invested happened when Bitcoin was giving up the greatest discounts? No. When people say 'buy low, sell high' - this is where the buying is happening.
The 720-day bull cycle and the 400-day bear cycle
For a larger image, click here
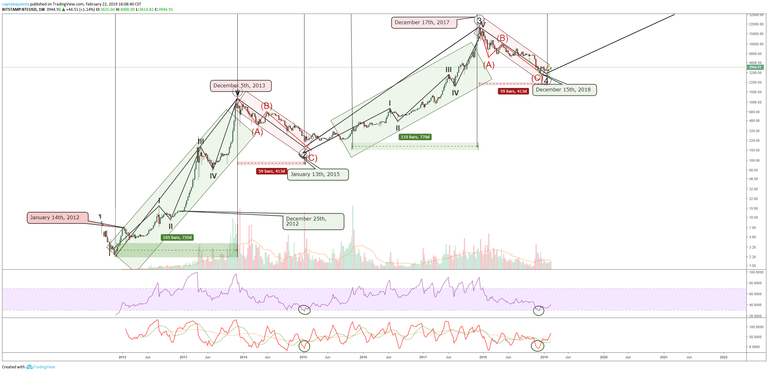
The all-time high of Bitcoin, $19,898 was made on December 17th, 2018 – over one year ago. If we look to the past we can see that dates around December 17th have also been of historical importance. The first swing high on this chart was found on January 14th, 2012. Another major swing prior to the first major rally occurred on December 25th, 2012. One year from that date range, we saw the 1st major and important swing high in Bitcoin made on December 5th, 2013 – which coincided with the Mt. Gox debacle. The low for the 413-day bear move was found on January 13th, 2015.
The green diagonal boxes represent the gradual (for Bitcoin ) rise and gradual increase in value that Bitcoin experiences prior to a major parabolic move. For both of those highlighted green box zones, we observe not only a very similar range of days (735 trading days VS 764 trading days), we also see a similar price and structure. When we look at the red highlighted boxes, we observe an even stronger correlation.
The red highlighted boxes have an almost creepy similarity. It’s uncanny. If we measure the peak of the first red box to the low, the downside lasted for 413 days. If we plot 413 days from the all-time high back in December of 2017, we see the week of January 28th, 2019. Another correlation between these red highlighted zones is something very, very Gann-ish: the dates. The date of the peak on the first red box is the week of December 2nd. And the peak of 2017 at the all-time high was the week of December 11th. We can also see that the period of the rise in the green boxes both happen during the beginning weeks of October (October 17th and October 26th, respectively). Gann wrote a lot about the importance of anniversary dates and to watch and record those dates because instruments will frequently find major highs and lows around those dates. We can see evidence of that on Bitcoin's chart above.
Volume
I also want to call your attention to the behavior of the participants which is reflected in the volume . We can see that the massive spikes and rises in volume appear near the peaks of the two red boxes, followed by a tapering off of volume until it comes back. Just this week (February 22nd, 2019), the highest volume in cryptocurrencies since the all-time highs (nearly equal) has come into this market. We can also see the conditions of the RSI on the weekly chart showing the extreme bottoming levels that form before the next rise. The current price conditions are certainly within the same kind of conditions we saw at the end of the November 2013 - January 2015 bear move.
Elliot Wave
There are a number of theories in Technical Analysis that are not all agreed upon by every analyst. Elliot Wave is one of those theories. Many adherents to Elliot Wave have a nearly dogmatic approach to the theory. I am not a big practitioner of Elliot Wave nor am I big advocate for its broad theory. Elliot Wave tells me one thing that I need to know and it is sufficient for my own trading: markets move in waves of at least 3 waves. On the chart above, I have laid out the first 4 waves of a longer cycle (I am not about to label it a grand or super-whatever-cycle, this will bring out the Ellioticians en mass). The inner impulse and corrective waves are also labeled and inside their respective color boxes. Essentially, we are observing the beginning of the final 5th wave of this current cycle.
What does this all mean?
For the tl:dr synopsis it means this:
Most likely we will hover the year at around current price levels.
I completely agree that now is an ideal timing to buy Cryptos. Not financial advice though.
This post was resteemed by @steemvote and received a 99.65% Upvote. Send 0.5 SBD or STEEM to @steemvote
700 days of upward action sounds so good. And I agree, this is probably the bottom.
and as for becoming a millionaire ...
IBM Blockchain President: “I See Bitcoin at a Million Dollars Someday”
https://steemit.com/bitcoin/@aferrell/ibm-blockchain-president-i-see-bitcoin-at-a-million-dollars-someday
Love it - there's quite a few folks saying it'll be in those 7 figure ranges now.
Elliot wave plus fibonacci.
There is harmonious mathematics at work in all of nature and it’s extensions - financial markets no exception... :-)
nice to have another perspective on the numbers of days for the cycles, maybe the pattern will repeat again.
————
🚀 🌕
Moon your steem everyday ! Instant Dividend payout after every game - FREE 1000 steemie first 50 players moonSTEEM.com
I want to be optimistic but I can't see BTC to start a great bull run now. But I really do hope that they will recover fast and stronger. best of luck! :D
This is the type of analysis that I like to see, and I completely loved and agree with your explanation. The markets (especially the charts) don't lie.
To me this is a priceless post, I´m saving it with me for the next few years!
(Obviously had to re-steem it).
Thank you very much! Really, I do do thank you for your comments! And I am very much looking forward to a continuing rise in value here over the next couple years. Hell, it could be a shorter wait time due to volume of participants and increase in professional capital.
I sure hope you're right! I wouldn't mind another boom...
excellent post @captainquenta
I think this is a very good trend summary
Thanks! :-)
Great and thank you for the info. I too believe that Crypto is not going away.
Super cool!! Excited for bulls to run!
Have been accumulating Bitcoins since 6000 USD.
Posted using Partiko Android
I do hope you're right!
Been looking forward to 2019 for the potential in crypto
It will be a beautiful and amazing ride higher all the way into late 2020.
El gana mas de 100 dolares con cada post y yo nisiquiera un centavo jajajaja que triste mi vida
You got a 26.02% upvote from @brupvoter courtesy of @captainquenta!
@captainquenta purchased a 60.09% vote from @promobot on this post.
*If you disagree with the reward or content of this post you can purchase a reversal of this vote by using our curation interface http://promovotes.com
Defended (41.06%)
Summoned by @captainquenta
Sneaky Ninja supports @youarehope and @tarc with a percentage of all bids.
Everything You Need To Know About Sneaky Ninja
woosh
This post has received a 53.37 % upvote from @boomerang.
Congratulations @captainquenta! You have completed the following achievement on the Steem blockchain and have been rewarded with new badge(s) :
Click here to view your Board
If you no longer want to receive notifications, reply to this comment with the word
STOPTo support your work, I also upvoted your post!
You got a 50.00% upvote from @brupvoter courtesy of @captainquenta!
wow very good publication
thank you very much!
Great $btc TA so I restreemed and tweeted the chart (with source link). I tried searching for you on CT and found a suspended account, are you using another @captainquenta?
Where?
Twitter
Good to see the graph, the bottom could be in, with the long climb for 2019 and into 2020 to the new ATH for Bitcoin.
I so hope that you're right with this theory. 700 up and 400 down. It also makes a lot of sense. Well, I took your idea a little further and "Fibonaccied" the whole thing. Here's what came out:
Ctrl + Click here to enlarge the image in a new tab (steemitimages)
The top image shows us how different Fibonacci retracement affect Bitcoin's price action. The bottom image show us what (insane) price levels we might achieve, if we follow the same cycle as the 2012 -2014 one.
Long story short: this next cycle might change our lives. Cheers to that! 🍷
Well this idea of yours really got me and I ended up writing a whole post about it.
You can check out my whole post here 😁
@lordbutterfly
Thx for the ping. Been seeing a lot of bullish analysis lately. There might be something there...
Posted using Partiko Android
I thought you might find this interesting. Glad you liked it :D
Very knowing your work good jod best trader in crypto
muy buenos datos, yo soy un poco ignorante por lo que paso de este tipo de informaciones pero esta vez me abrió los ojos ya que nunca había escuchado esto del bitcoin y hace que sienta curiosidad por el posible furuto en el que caera esta moneda :)
Congratulations @captainquenta!
Your post was mentioned in the Steem Hit Parade in the following category:
Get ready for impact dapps taking over the bulls are here to the moon
I don't know why we have to compare exactly to 2014~15 bullrun. At that time, the bullrun was very fast and sharp incline, which led to quicker bear. The bullrun that just ended was longer and a more steady growth, which will lead to a longer bear. In 2018, look how many lower highs were created. I enjoyed your info, but comparing exactly to the 2014~15 bullrun is not correct
Posted using Partiko Android
Also where is the capitulation?
Posted using Partiko Android
November 2018
Nah. I don't think that was capitulation.
Posted using Partiko Android
There us still too much hopium. That has to die out before a phase to start
Posted using Partiko Android
I'm just using the technical analysis definition of that move - Gann called it a 'blow off' move, Dow called it a 'panic phase' - its all indicative and evidence of a capitulation move and specifically in Dow Theory and Gann Theory, these moves are the final moves in a bear market.
This was a very good read, very informative
1 Million Dollar
me too,i0m believing in it … but someday ?? …
will we be alive .. or our kids ??
I agree with your analysis @captainquenta, I think that the crypts we corrected enough since they came from the bubble, now they begin to enter the daily life of all of us and consequently they start to be appreciated by governments and institutions because they understood that it is an innovation of the economy.
The bitcoin for me will be the substitute for gold, an innovative safe haven, its price in a few years we definitely find it again on $ 20,000.00.
Interesting point for longterm investors but I can`t see it finishing in a simple ABC correction using elliot wave theory.
In my opinion it is a WXYZ correction which could lead us down to $1800 - 2000 but at first short term brings us up to $5000. I`m presenting the bull and bear count on my blog. Feedback appreciated :)
Good luck to all who believe in Crypto
Wooo
Weeee
I disagree with you, No trendline BO, no fear capitulation volume, no MA broken, especially the 50MA(which is a clear signal of bull market), in EW we can also be finishing the 4th wave(ABC pattern) with another 5th wave down(double bottom at least or even further down to 2500,1800 or 1100), 2014 fractal says the same thing...we only have 2 things telling us the bottom is in which is the 200MA and the adam and eve pattern... Don't spread FOMO, tell the people to buy when the market has clear signs of a reversal, can the bottom be in? yes, but it's not obvious enough, you need more signs to call a reversal, especially the 50MA one! Once you see the price breakout of that one it's a 99% sure sign of a reversal deploy all your money in...
All the possibilities in 1 single picture, with the bullish one being the least possible one since it would breakout of trendlines... I'm expecting capitulation to occur until june if the bottom isn't in already, will change my mind if I see any signs of a reversal ofc,
https://steemit.com/steem/@awaiskhan12/100-dollar-earn-in-a-day-without-investment
Complètement faux. Noob
Posted using Partiko Android
I am buying little by little every week although I believe that in the coming months BTC and the cryptocurrency market will continue to move around current levels. I think there is a greater accumulation of bullish momentum.
Quisquam et quis exp
Quisquam et quis exp
Me párese muy interesante
Posted using Partiko Android
Apply the sentence slowly but surely, great information, do not desperate, I see bitcoin great in next decade.
I think the next big boom will be at the end of 2021. Based on the math below that led me to a 6 month doubling time.
7/17/2010 BTC USD price $0.05
2/23/2018 BTC USD price $10,000
91 Months/2,730 days. 6 Month doubling time
(BTC doubles every 6 months, 2 times every year)
2018 = $40,000
2019 = $160,000
2020 = $640,000
2021 = $2,560,000
2022 = $10,240,000
2023 = $40,960,000
2024 = $163,840,000
These numbers are hard to believe, but remember all fiat is unlimited. Take a look at the TRILLION dollar notes in Zimbabwe and Venezuela. A single bill worth TRILLIONS of dollars. $2.5M in USD fiat is nothing. Bitcoin is unlike anything we've ever seen and I'm extremely excited!
So you assume that what happened will happen again?