Conclusion for today’s Neo technical analysis: Price closing below 10.39 implies more selling in Neo.
Neo price analysis is carried out on a Daily timeframe using a candlestick chart. A bullish price channel is used to capture the trend from a price low of 5.50 starting from December 15, 2018 to current date.
It is crucial to pay attention to the chart pattern mentioned above as it has remained valid over the past 8 months....eventual breakout will help provide the next direction of trend and momentum.
Instagram: https://www.instagram.com/coin_analyst/
Twitter: https://twitter.com/Cryptotrader029
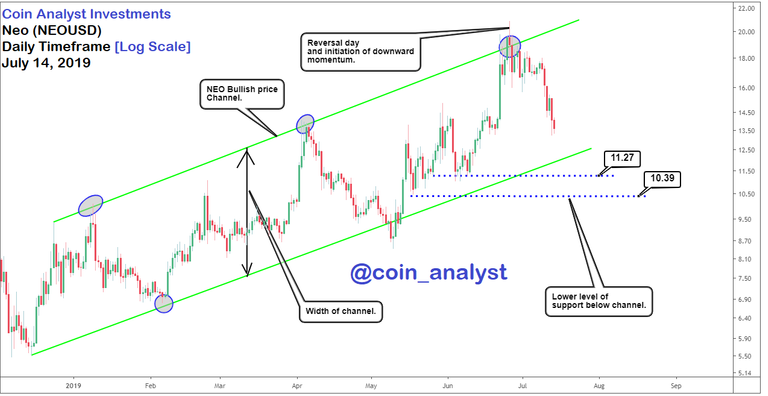
The width of the channel is indicated on the chart and can be used for projecting the minimum target for the price of NEO upon confirmation.
Formation of a reversal day candlestick and retracement of price from the upper boundary of the channel after attempts at a breakout failed implies the bottom of the channel as target. Lower level of support below the channel is indicated by the horizontal range between 11.27 and 10.39.
A close below 10.39 does improve the chance of an even deeper retracement in the price of NEO (NEOUSD).
Our previous Bitcoin analysis (BTCUSD) before the current price rally was also posted for FREE and can be found here.
https://coinanalyst.investments/2019/04/26/btc-analysis