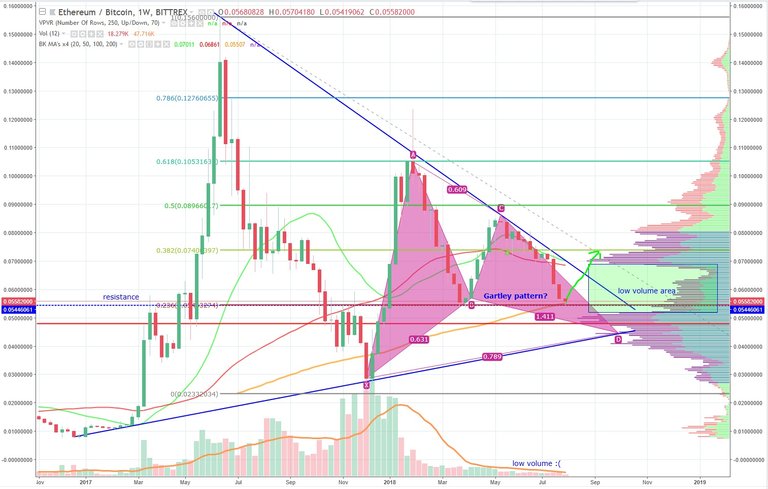
Hi my friends, here is weekly Ethereum chart.
Now the price is in the important area. The price is currently bounce by MA20, fib 0.236 and resistance (dashed blue line). I expect the price go up and break the blue trendline . I'm waiting for an increase volume and ideally a long green candle.Otherwise, I think the Gartley pattern will be completed.
If you want to update,please give me like, thank you.
Majkee
(I am sorry for my English)

@surikowstepanuk, because my English is terrible or because you do not understand the technical analysis?