The Moving Average Convergence Divergence (MACD) indicator is a momentum and direction analysis tool used to indicate key entry and exit points into the market.
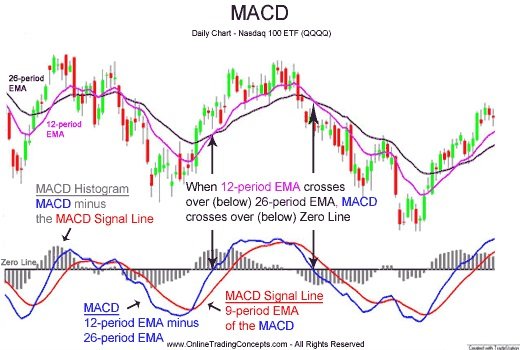
The MACD is made up of two components, the MACD line (blue) and the Signal line (red). The MACD line is the difference between the 12 period exponential moving average (EMA) and the 26 period EMA, where the Signal line is the 9 period EMA of the MACD.
The position of these two lines can be a signal for a bullish or bearish movement in the following ways:
Lines Crossing
When the MACD rises above the Signal line this can often be bullish behavior and can lead to an upward movement in the price. On the flip side, if the MACD falls below the signal line, it may be time to sell off some assets as a reversal to the downtrend is possible.
As always, it's key to wait for a confirmed crossing before entering to avoid getting caught out.
Line Gradient
A sharp increase in the MACD suggests that the asset is potentially becoming overbought and could start showing signs of reversing to the downtrend. Again, the opposite behavior also exists. This is similar to the Relative Strength Index (RSI), and these two indicators are often used in tandem to give a more complete picture of momentum. A shallower gradient suggests a more organic movement is in place and is less likely to suddenly reverse.