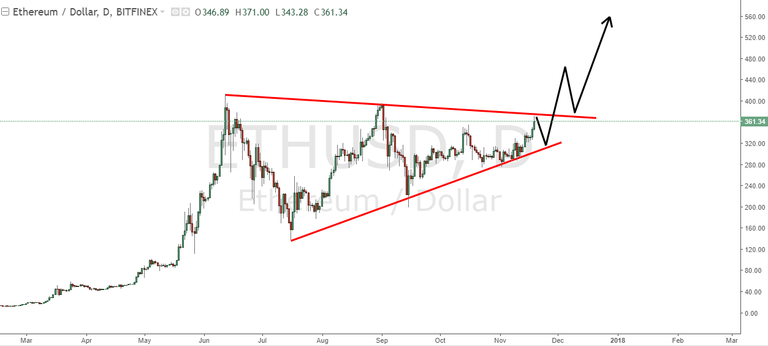
Ethereum is quietly approaching its June 2017 all time high. With all the recent rumour revolving around the BTC vs. BCH debate, the No. 2 cryptocurrency in terms of market cap is about to retest its peak.

The peak price of about 390 USD was first retested in September when Ethereum failed to surpass it. Now the chart has formed a clearly visible ascending triangle which occured during an overall uptrend. This chart pattern supports the second attempt to break the high. The good news is we're looking at a daily chart so there's still enough time to jump on the bandwagon. Moreover patterns emerging on a higher time frame tend to verify more often than on lower timeframes.