If you’re one of my patrons, take a look in your email box. I sent you a six-page report detailing the exact same forecast, timelines and also things to think about, as society moves forward, and people become more aware of the situation around them.
How is economy going to behave? How are people going to pull money out of their savings stocks? Whatever it is, the economy is going to contract. And how are people going to react once they realize that this is a decade-long event and they are on their own to prepare their own food and to organize communities?
We’ll also see how this gargantuan shift affects perception of what’s possible in terms of solutions.
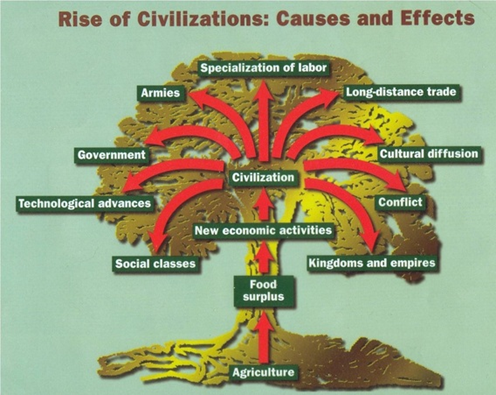
As it’s always been said, food surplus gives rise to civilizations. You’ll find this through history, every time there’s excess agriculture production, civilizations rise and flourish. However, when there’s not enough food, they contract or collapse. This has been seen through tens of thousands of years of history.

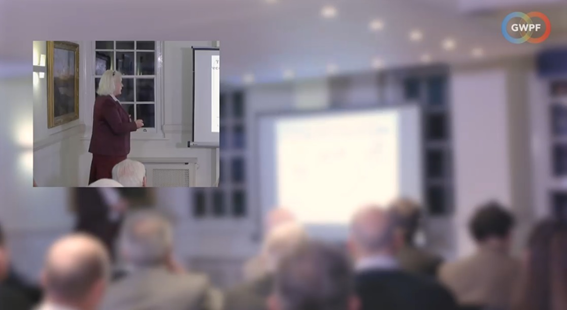
Speaking of incredibly long timelines, during Professor Zharkova’s presentation, this image, for some reason, was blocked out. I’ve linked below the rest of the presentation so you can go right to the video of Global Warming Policy Foundation. Check out this entire presentation. Excellent! Except when it comes to this and one other slide, which talked about long time durations and repeating cycles, were suddenly obscured.
During the question and answer session, there was an incredibly overblown and overexposed image of this. I was able to enhance it and this is what we have. Oscillations of the solar magnetic field. This is what Professor Zharkova had done with her team, gone back at least a hundred thousand years looking at magnetic fields on the Sun.
You can see this clearly points to the Electric Universe. The magnetic oscillation waves show this has nothing to do with an internally combusting star, it is an electrical wave in front of you. She also mapped that out into Grand Glaciation Cycles going back 400,000 years.
We have this incredibly long timeline to get a baseline, if you will.
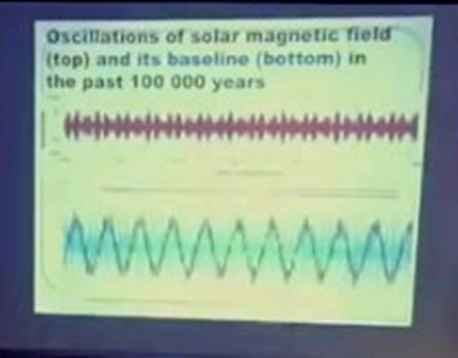
Looking at the realization of 400 year segments in time and all the cycles interwoven within just these last 4 centuries, think about 400,000 years. If you’re going to map that out, this 400 years of time would literally be just a pencil mark in time. Even if your graph was a six feet long, this would still be pencil-mark in thickness of the amount of time in that entire cycle of Grand Glaciation Cycles.
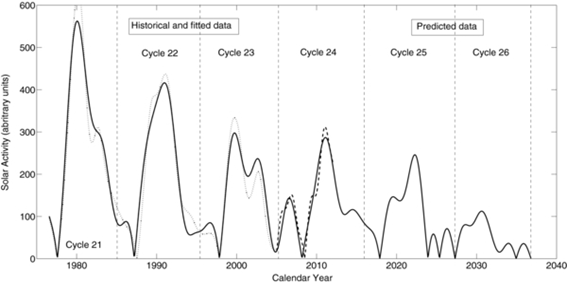
Her forecast stands as Solar foot Cycle 25 declining and Solar Cycle 26 almost no agricultural production from 45 north latitude and above.
To put that into context this year alone, the global wheat crop was reduced between 5 and 8%; rye is also down by 30%, rice down for about 5%, but others like corn and soy have great harvests.
As we progress between now and 2028, it’s not going to be as if on January 1st, 2028, there will be a sudden food scarcity on the planet. It’s going to lead up to this. It’s going to be a lead-in to that point of scarcity.
The question you might want to ask yourself is, over these next ten years, is it going to be a linear decline or will there be huge drop one year and then the next year it’ll flatten out, or maybe two years and then it’ll drop off again? It looks like 80 to 90% reduced yields globally of what we’re getting right now.
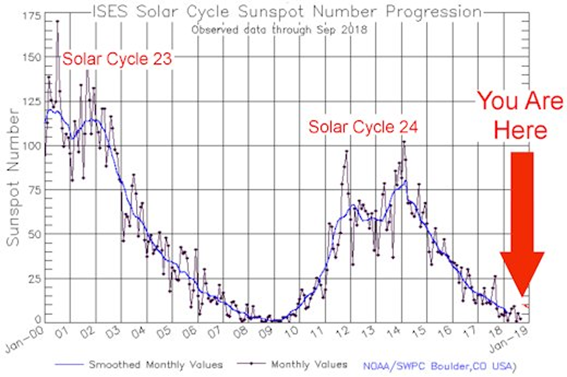
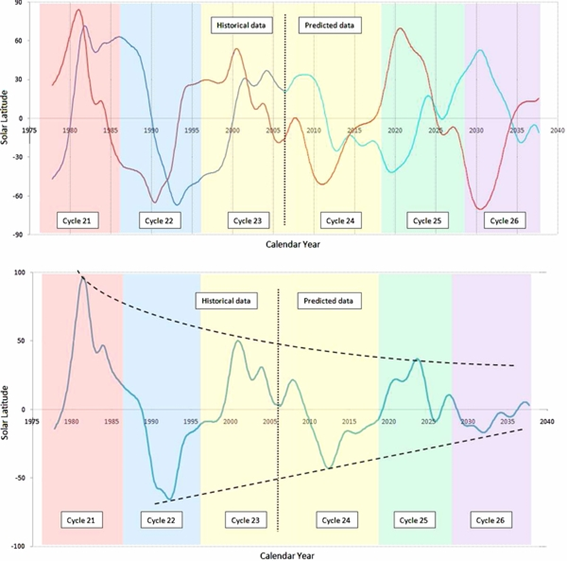
You are here at the big red arrow. You’re going to be here for another year or so until we get into Solar Cycle 25. There’s a plethora of forecasts out there of the Solar Cycle being a little stronger, about equal or less than this last SC that we’ve experienced. We have seen massive weather changes in the last year, so as we move forward, if the Solar Cycle is even less intense than predicted, there will be less than 50 sunspots, averaged. We’re going to see types of things that haven’t been recorded in centuries, that will be occurring on our planet on a daily or weekly play-out of the news.
Take a look at the magnetic fields of the Sun, that’s the graph below. When fields get into that wide canceling wave, that’s where the extreme weather is. You can see how solar activity declines match that in the graph below.
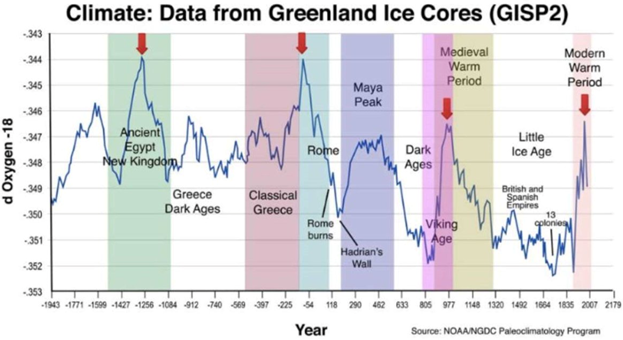
During the question and answer session, Professor Zharkova referenced that each successive heat spike coming out of these warming events in the past 9000 year is going lower and lower. The modern warm period, I disagree with this chart put out by NOAA and so far it’s only 0.2 degrees Celsius above baseline. Where that red arrow is, there should be a drop of at least 1 degree Celsius, possibly 1.3 degrees Celsius which would bring us below the medieval warming period.
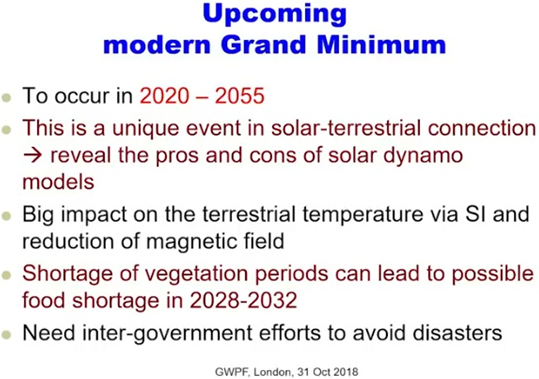
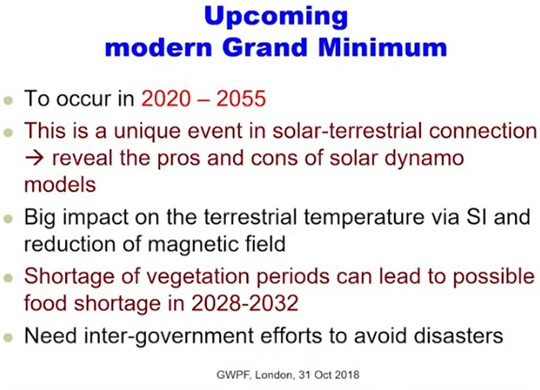
With the slide here, please realize that Professor Zharkova has been so tight-lipped about the effects on society of the Grand Solar Minimum.
Suddenly she comes out full force and says, “there is possible global food shortages on 2028 to 2032. You’re going to need intergovernmental connection and cooperation to stockpile now for these lean times later”.
Notice the top line also, we’re going to taste it, feel it, and smell it in 2020 and it’s just going to intensify.
To put this in perspective, we’re getting a wisp right now, a very mild taste of what’s going to come. If she’s putting 2020 as the categorical start date of this event, we’re not even there yet. This is just a warm-up to what’s coming.
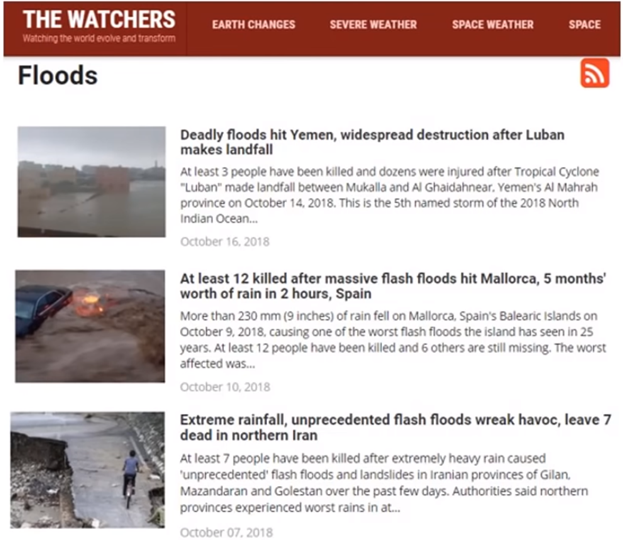
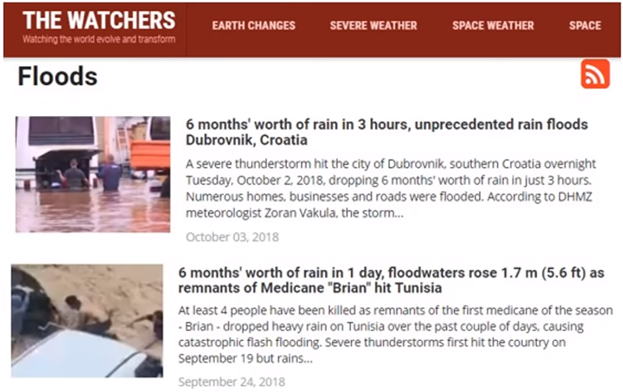
You’ve seen these massive weather events across the planet these last six months, a year worth of rain in Oman in a day.
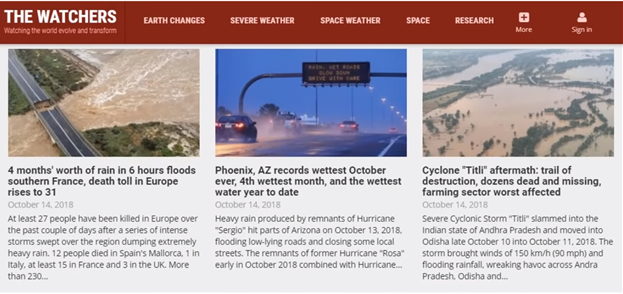
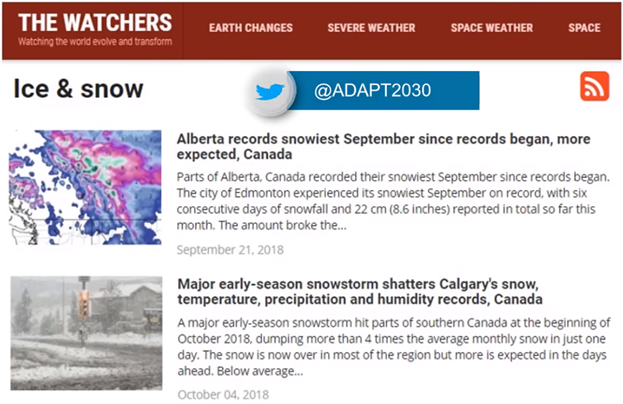
Six months’ worth of rain in so many spots across Europe. Record snowfalls in August and record snowfalls in October. Massive winds.
And you’re seeing it everywhere, if you’re even halfway paying attention to the news feeds across the planet.
What’s to come as we intensify into this? It is an unknown.
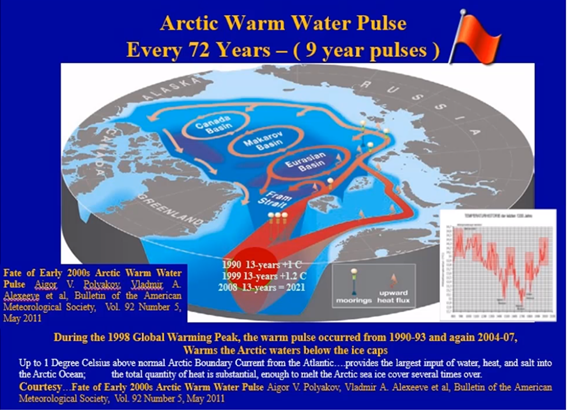
What is known is that, Atlantic water temperatures are responsible for European cooling or warming. Presently the Atlantic Multi-decadal Oscillation (AMO) is going into its 60-year cool phase. Notice all the blue, that’s cooler than average water and that’s being pushed up under the Arctic ice sheet.

David Dilley did some great research on this and from this point forward, as the Atlantic cools, there is going to be cooler water circulating under the Arctic Circle. This means that the ice should be thicker and remain thicker, longer into the melt season.
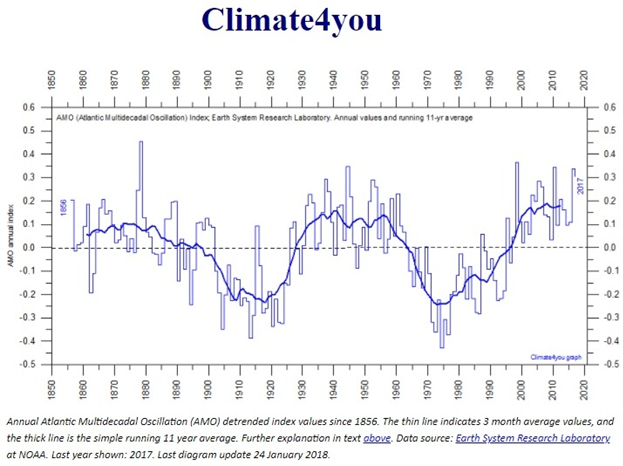
Here’s a graph for you, Climate4You, a great place to stop to get a lot of research information. This is the 60 year Atlantic Multi-decadal Oscillation. As you can see, it’s going to trend down for the next 30 to 35 years as we’re heading into the Grand Solar Minimum.
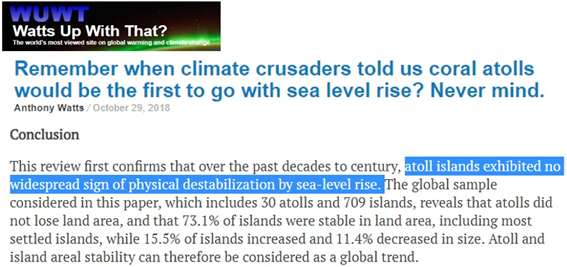
You’ll hear everybody’s saying, “The experts say it’s not going to happen. The experts say that the warming is going to overtake the cooling.” Well, what did these same experts giving us as forecasts in the past? Let’s take a look at the Pacific atolls.
(BELOW) Kiribati Islands, Red line is 2013 and blue line is 1969. This is the amount of loss or gain on the atolls, that are just feet above sea level.
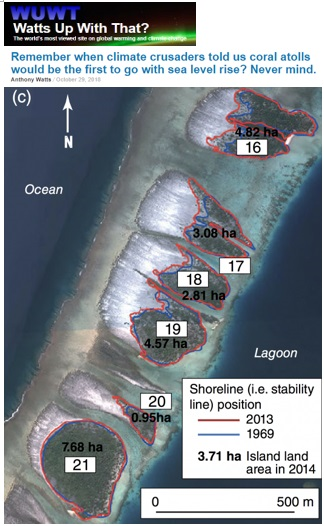
Kiribati was supposed to be the poster child for land loss due to rising seas, as well as Maldives. But it’s not happening in either of those places. So if you’re going to look at the experts that have been telling you this would happen but it’s not happening, well, I might seek a second opinion.
Let’s jump over to the report where this came from, the conclusion was, over the past decades of the century, coral atoll Islands exhibited no widespread sign of physical destabilization by sea level rise. It is contrary to what you were told, that Greenland is melting, the Arctic is melting, the Antarctic is melting to infinity and it’s going to cause massive sea level rise. They’ve been telling us that, since 1990, we have almost 30 years to think that if this was in play, it would have been in play by now and we should have seen some changes in the sea levels. But nothing.
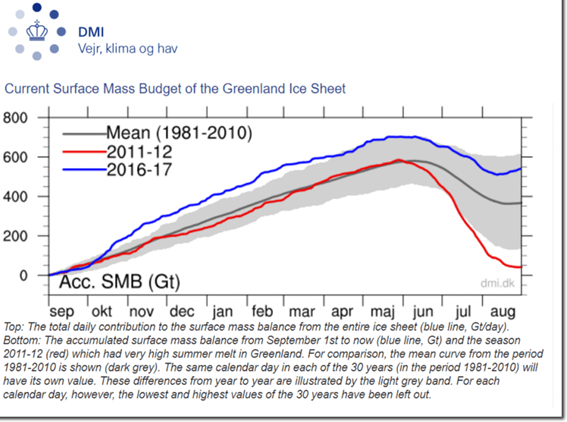
The same experts also guarantee that this warming of our planet is going to overtake the Grand Solar Minimum. Well, the blue line, above 1981- 2010 average is the 2016–17 ice gain in Greenland. I thought it was supposed to be melting? Here it is, Greenland gaining ice last year.
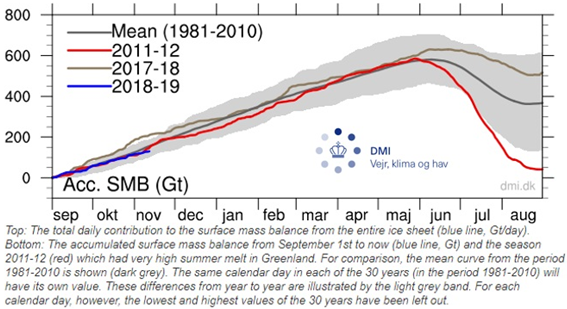
As we progress into these few months, it’s right at the baseline of 2018–19, there’s another prediction that’s not panning out. I thought Greenland was supposed to be almost bare rock by now, massive melting, or that’s what they told us in the 1990s. Then again 30 years passed, but here we are, gaining ice on Greenland.
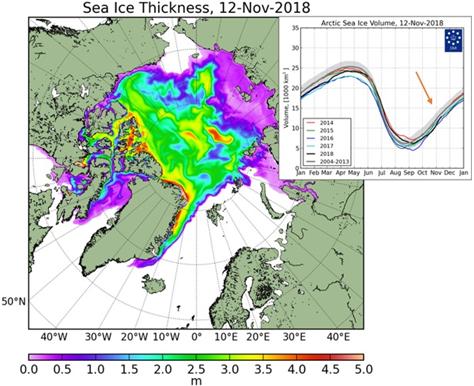
Another projection was, there would be no sea ice in the Arctic during the summertime. We heard that in 2005, 2007, 2009, 2013 and then there was even more ice this year. It seems that sea ice is increasing at the moment.
The narrative was also flipped about the ice. Remember it was always about the decrease in the thickness, well, now since the thickness is increasing due to the cooler water from the Atlantic going under the Arctic, they’ve reverted back to talking about the actual coverage. But that’s not working either because that black line is showing you again that in the last several years, it’s not anywhere close to being the lowest on record.
How many more failed predictions do we need to hear again and again, before we start looking for causations other than CO2? They’re telling you that CO2 warming is going to overpower the Grand Solar Minimum which will be here in two years. If it’s taken 35 or even 30 or even 20 years and nothing’s happened yet with CO2 projections, my bet on listening to solar physicist and solar researchers that are giving us a warning. Time’s up.
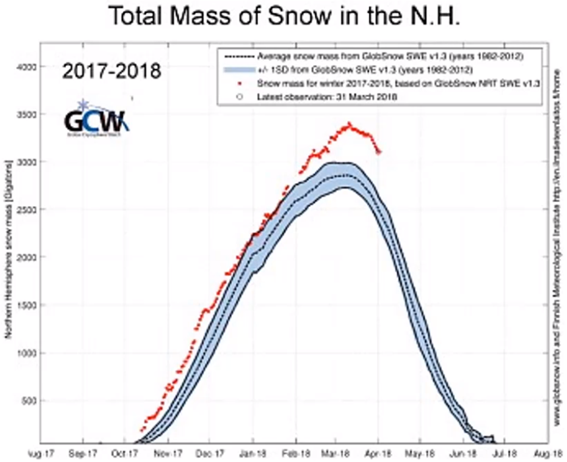
Another case in point. We were told by Al Gore “your children will never know what snow is”. Yet that red line, is record snow for the Northern Hemisphere for the 2017–2018 winter. What’s that, strike four, already?
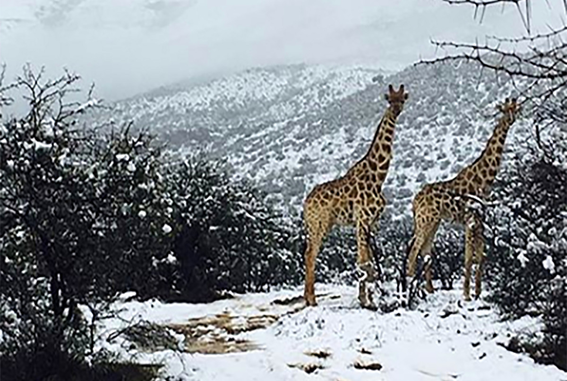
What do you think about giraffes in snow? Does this look like a normal event to you?
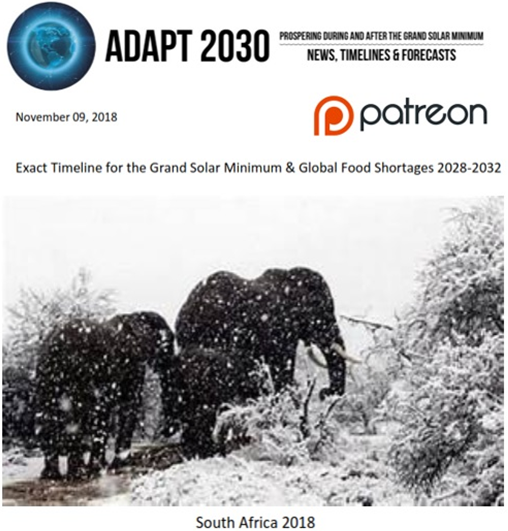
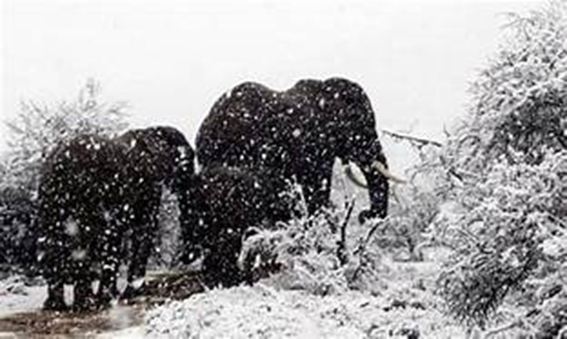
If you don’t like giraffes, how about elephants in snow? That’s normal, isn’t it?
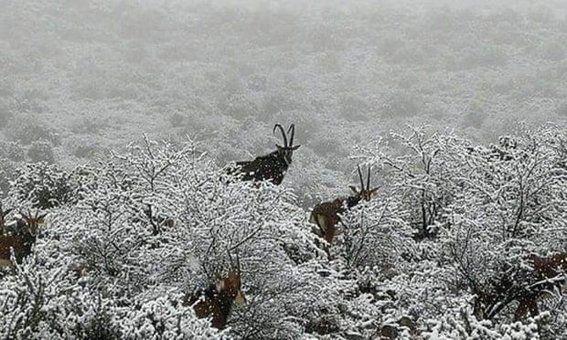
Kudu in snow? I’m sure snows have come to South Africa prior, probably, 1940s or turn of the century, 1880s. It’s a repeating cycle. You need to go back in time to find the exact same set of circumstances because history and climate repeats itself.
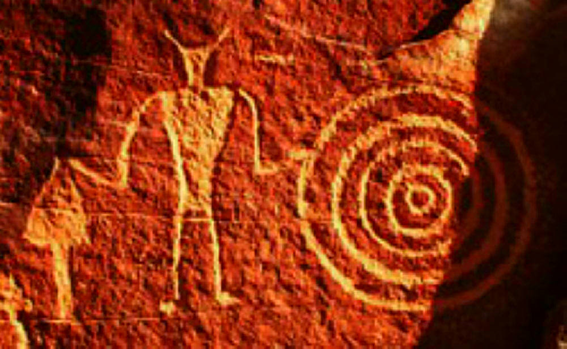
This is why the ancients worshipped the Sun. This is why they were so fixated on the sky, because a new cycle is repeated. The repeating cycle affected food production, weather systems and ultimately the society. The leaders of the society were generally overthrown or taken out of power because they could not provide for the people and they always blame that on the heavens.
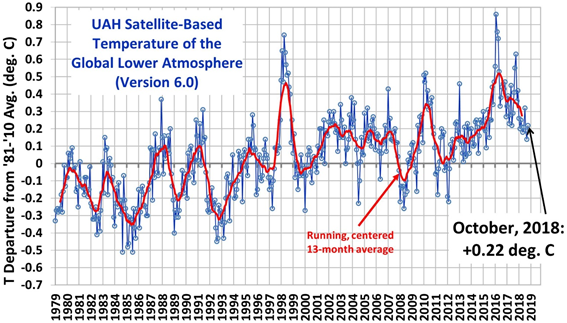
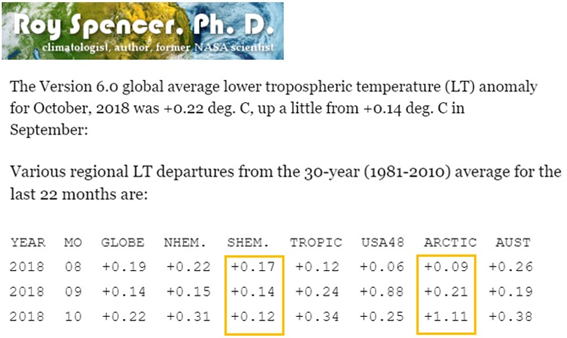
Dropping in to take a look at the University of Alabama Huntsville (UAH) satellite temperature set here. October was supposed to be a hot month according to the mainstream media, now recorded at 0.22 degrees C or two tenths of a degree above the baseline from 1979 in the 30 year average.
I also like Dr. Spencer’s research because he shows you the area of the globe broken down by temperature. So what I did is pulled this last three months, August, September and October. Notice in the yellow boxes I included there, the Southern Hemisphere continues to decrease while the Arctic continues to increase. Although the lower 48 of the US shows some declines as well.
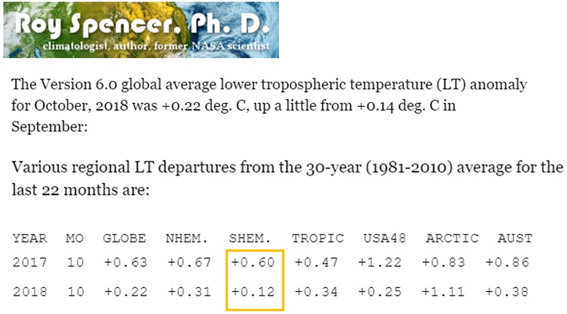
Because the data set also includes last year from the same months, I thought I would line it up with October, 2017. Southern Hemisphere again, showing the largest declines in temperature. Arctic is up a little bit. The Southern Hemisphere is decreasing far more than the Arctic is increasing. The link to everything is below so you can do your own research to check out these datasets.
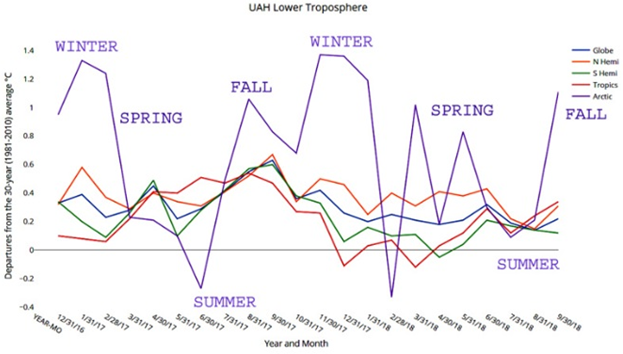
At the same time, Watts Up With That had a really interesting article talking about the Arctic temperature profile. These new temperatures were released back in October, and the worst of Arctic anomaly is up there.
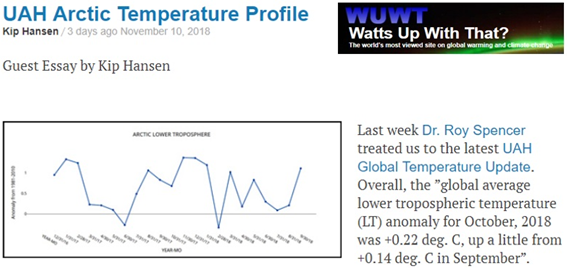
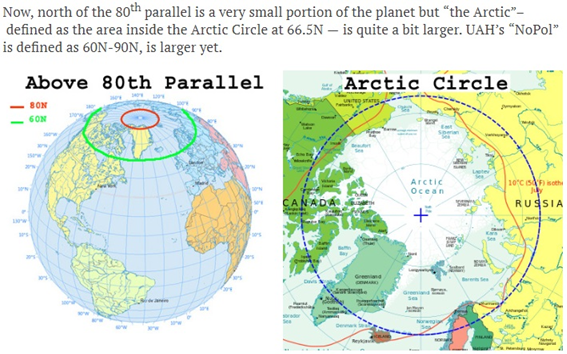
The difference in measurement is around the parallel. So Danish Meteorological Institute, the DMI, captures their temperatures from the 80 degree north latitude mark up to the North Pole while UAH captures that data from 60 degrees north up to 90N. There’s 20 degrees of distance difference. Remember each degree is 60 miles! There is a substantial difference around the Arctic Circle where it’d be warming or cooling.
Case in point. This is from UAH’s set. Notice the winter and the summer temperatures.
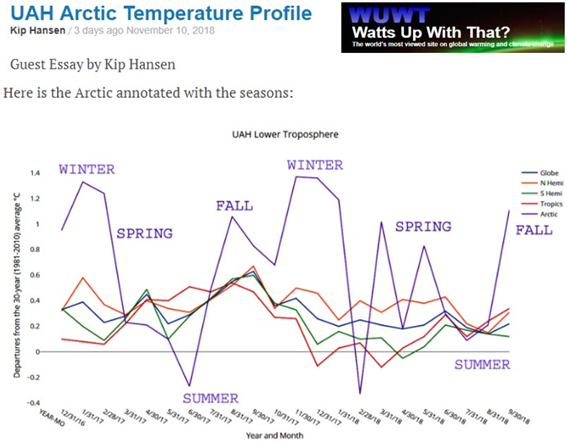
It seems that the summer temperatures continue to be cooler year upon year, whereas the winter becomes a little bit warmer year upon year. If this trend continues, just extrapolate that out for the next 30 years, and see where we’re going to go.
If the summer continues to be cooler, that’s going to have more effects on the storm systems that form over North America.
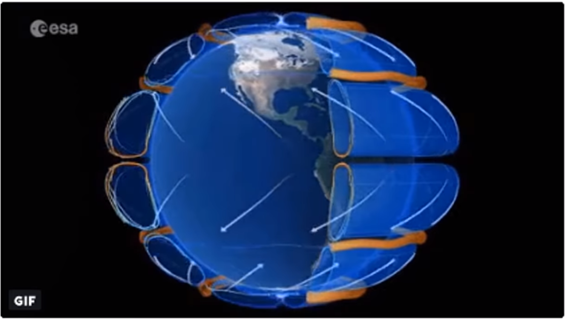
My takeaway was about the cloud cells. The difference of temperatures is affecting the movement / circulation of the cloud cells themselves. The temperature inversion or difference is what’s driving weather systems and the formation, movement / circulation of clouds.
What it means for you and I is a more intense Polar Vortex, deeper troughs pushing further south, and also the summertime is expected to have warmer temperatures with the Equatorial Vortex. You see the same exact thing coming off the equator moving really far north, all the way up to Norway, even further than Norway from the equator. Expect to see some of these polar vortices pushing really far south into the Caribbean. I would expect in the future; they will experience record cold temperatures.
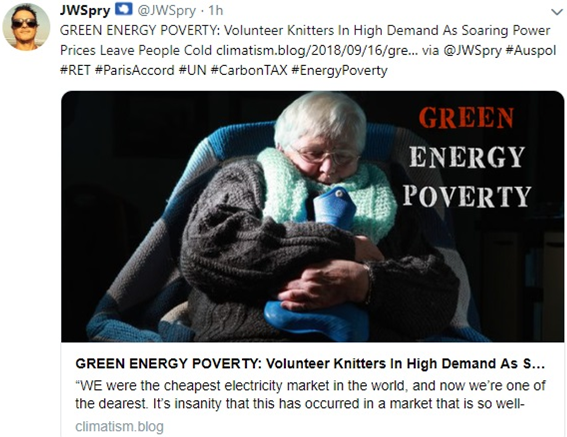
The last thing I want to mention here is energy poverty. This is literally when people cannot afford energy prices in their homes for the winter heating, and they freeze to death or they leave.
That’s one subset, but when your food doubles or triples in price, there’s really no way NOT to eat. If you don’t have electricity you can move in with another person, you could share utilities if somebody else moves in. There are a lot of ways to take care of that problem.
Same with fuel if it gets too expensive you can carpool or you can take public transportation. We can’t not eat. That’s the problem we CANNOT NOT eat. There’s no substitute for not eating, food and nutrition.
As we move forward down a timeline to 2028, I’ll put out the question: How quickly do you think these price rises are going to manifest across our society? Because everybody’s going to wake up by 2022, the plight that we’re in and once everyone understands they have less than six years before there’s not enough food to feed this planet. At what point do they start shifting their spending habits, their investment habits, and their moral habits? I’ll leave you with that.
Thanks for reading. I hope you got something out of the article. If you like this type of in-depth analysis, Mini Ice Age Conversations, tri-weekly podcast on Libsyn, Soundcloud, iTunes or anywhere you can find a podcast host across the net.
Join ADAPT 2030 NEWSLETTER
Mini Ice Age Conversations Podcast
iTunes: https://itunes.apple.com/us/podcast/a...
Soundcloud: https://soundcloud.com/adapt-2030
Libsyn: http://adapt2030.libsyn.com/
MIAC #122 Would you tell the population of the impending changes on Earth?
http://adapt2030.libsyn.com/miac-122-...
ADAPT 2030 & My Patriot Supply: Taking the Fear Out of Difficult Situations
2-Week Food Supply: (1,500+ calories/day with 92 servings)
http://www.preparewithadapt2030.com
ADAPT 2030 Amazon Grand Solar Minimum Book Store
https://www.amazon.com/shop/adapt2030
*** Today’s Story Links ***
Giraffes and Elephants in snow https://www.thesun.ie/news/3103699/gi...
Solar Cycle diagram 2018 https://pbs.twimg.com/media/DrT6swQX0...
Long Term climate cycles https://andymaypetrophysicist.com/201...
Luni-solar connection https://www.omicsonline.org/open-acce...
October Temperatures Global
http://www.drroyspencer.com/wp-conten...
http://www.drroyspencer.com/2018/11/u...
Island did not disappear https://wattsupwiththat.com/2018/10/2...
UAH Arctic Temperature Profile https://wattsupwiththat.com/2018/11/1...
Current Surface Mass Budget of the Greenland Ice Sheet
https://www.dmi.dk/en/groenland/maali...
Sea ice thickness http://polarportal.dk/en/sea-ice-and-...
*** ADAPT 2030 Social Media Links ***
1.) PATREON www.patreon.com/adapt2030
2.) BITCHUTE https://www.bitchute.com/hashtag/adapt2030/
3.) STEEM https://steemit.com/@adapt2030
4.) *** ADAPT 2030 True Leaf Market Link ***

5.) Mini Ice Age Conversations Podcast
Libsyn: http://adapt2030.libsyn.com/
iTunes: https://itunes.apple.com/us/podcast/adapt-2030-mini-ice-age-conversations/id1200142326
6.) FB https://www.facebook.com/Miniiceage
7.) TWITTER https://twitter.com/adapt2030
8.) YOUTUBE www.youtube.com/user/MyanmarLiving
9.) MEDIUM https://medium.com/@globalcooling
Hi David, trying to help spread the message :) and IAF Christian's to.
[resteemed]
Rob (TeamEggmotor)