
Dear friends,
I continue monitoring the Old Bitcoin. Let’s take a look at the previous forecast and compare it to the current situation
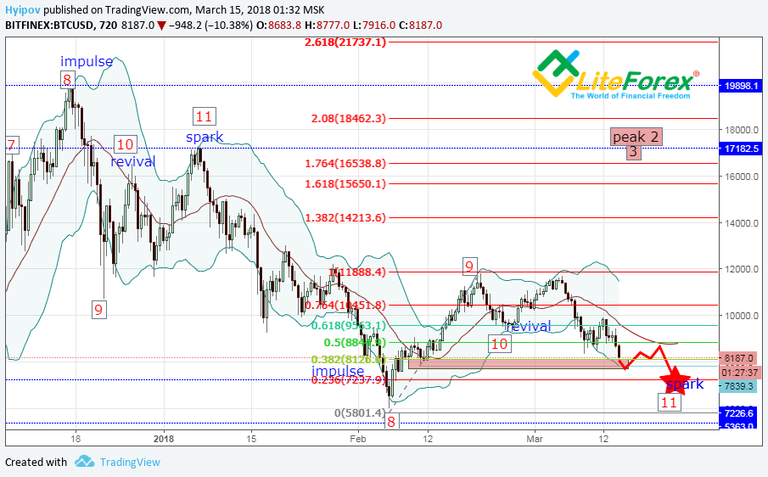
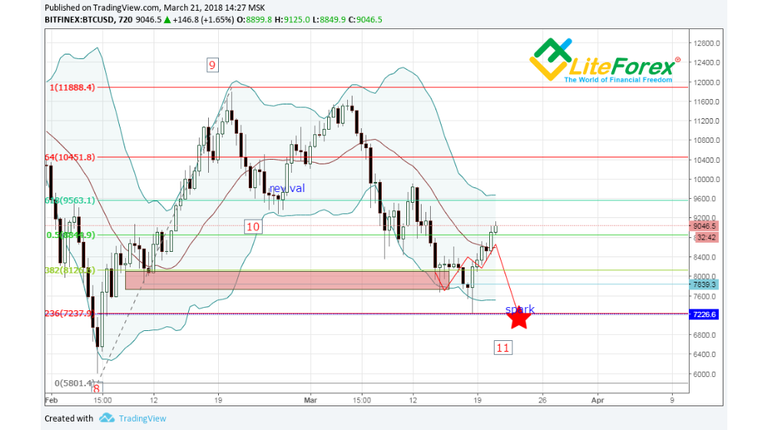
In the last chart, we see that, although the ticker move is quite similar to the expected one, there is a significant change that makes us revise the current targets.
It is about the lows at the levels of about 7 325 USD, the ticker reached already on March 18. After that, Bitcoin quite strongly rebounded and got stuck at the level of 9 000 USD.
If we apply fractal analysis, this fall indicated a perfect peak for the final bearish fractal’s element, Spark.
Having rebounded, the ticker broke out the middle Bollinger line, indicating this element to close.
Therefore, a deep fall, and moreover, the lows’ renewal, will hardy occur, according to fractal analysis.
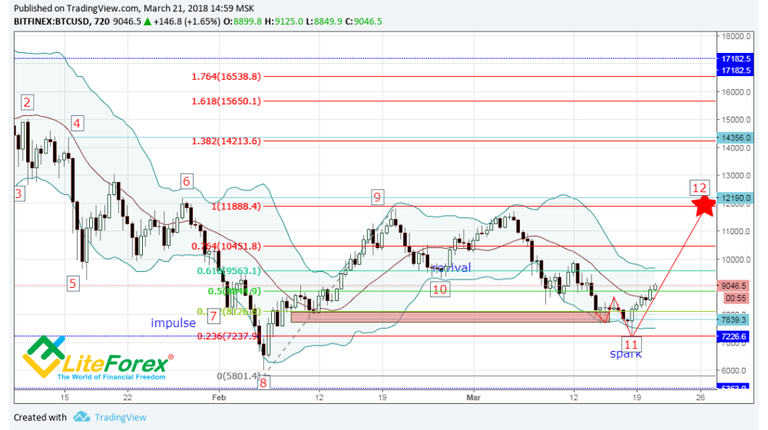
According to fractal analysis rules, we know that level 12 is limited in its moving by levels 6 and 4.
Considering the fact that levels 6 and 9 almost coincide, we can state a high resistance level for the ticker to be exactly at 12 000 USD.
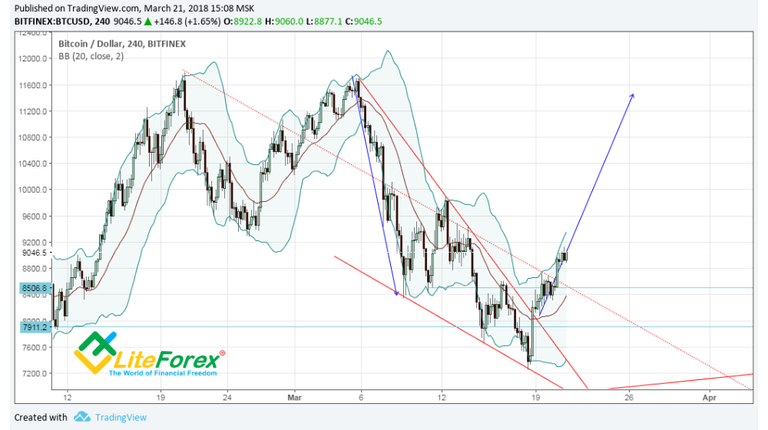
If we apply graphic analysis (see the chart above), the ticker is implementing the Falling Wedge breakout, whose target indicates the level at about 11 500 USD.
However, if we take a closer look, everything is not so good.
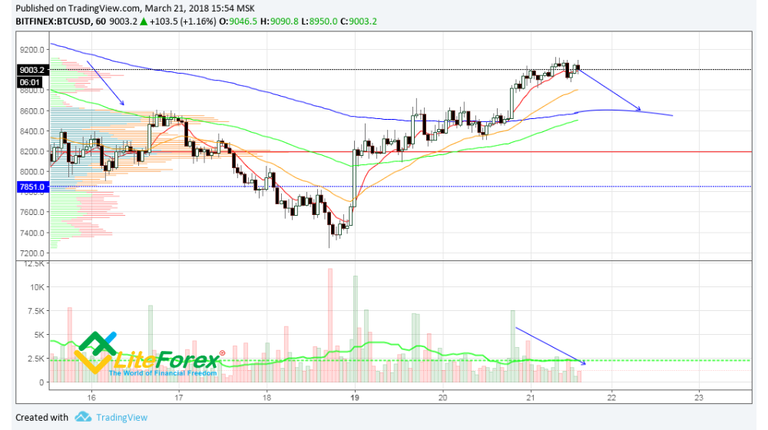
When analyzing the volumes we see that the price growth is not supported by the volume growth. Vertical volume indicates the zone for the correction at the level of about 8 600. According to the direction of EMA 200, there will also be a strong support somewhere at about the same level.
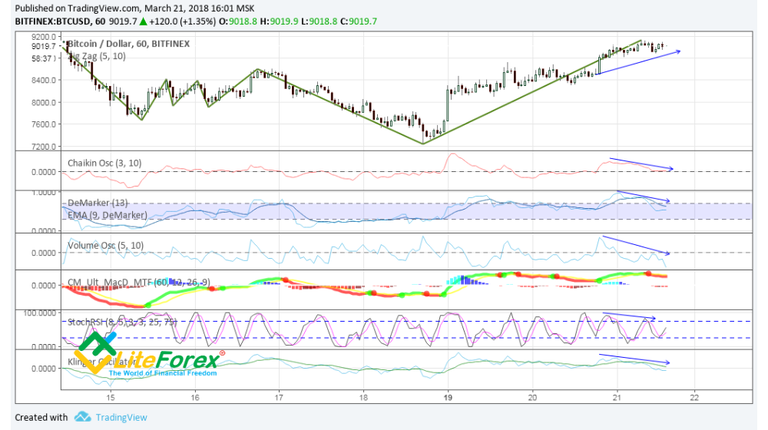
If we look at oscillators, there are also divergences that confirm the correction likelihood.
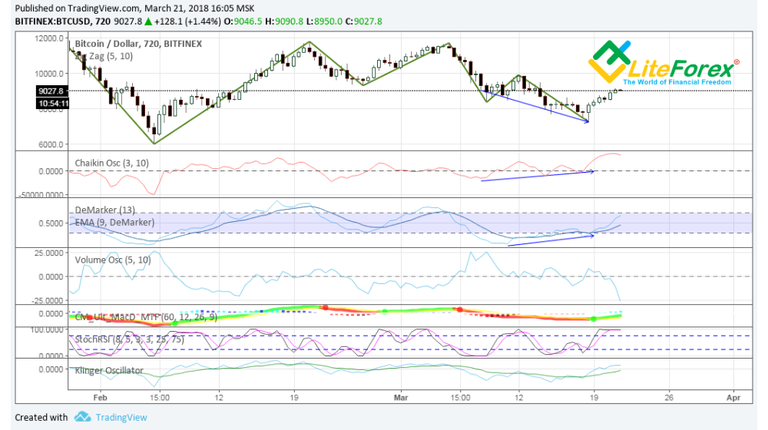
Nevertheless, it is still too early to think the bullish divergence in 12-hour timeframe to be worked out.
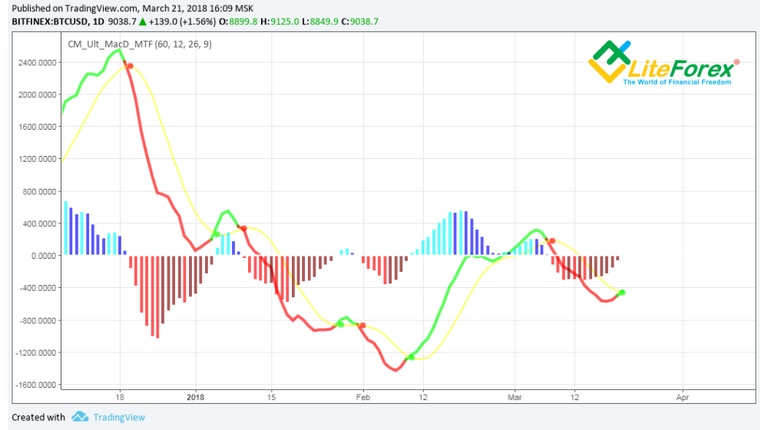
If we look at daily MACD, it has just sent a buy signal. Although this indicator is thought to be strongly lagging, a bullish signal in daily MACD is very rarely followed by a correction in the opposite direction.
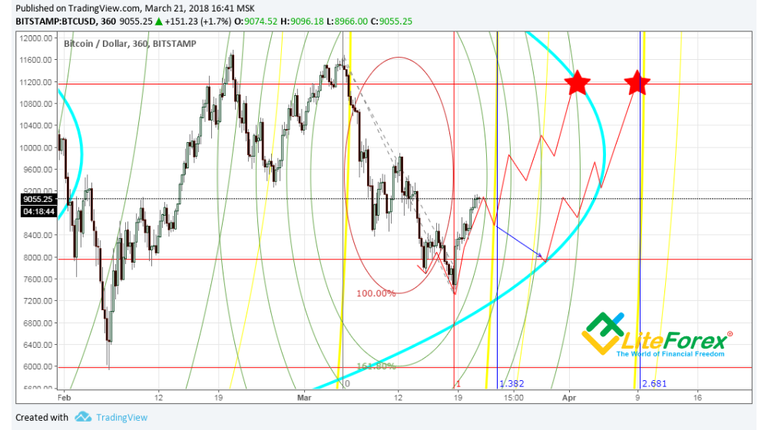
Finally, let’s analyze Fibonacci levels.
Considering all the above, the local correction can start soon. It will inevitably meet the yellow Fibonacci arc, and a strong momentum from it can be expected.
Fractal, graphic and indicators analyses indicate an upward momentum to be likely to occur.
However, it shouldn’t be forgotten that the turquoise arc has strong magnetic properties. So, we can’t totally exclude the price moving down to 8 000 USD
Anyway, I think the general trend direction to be upward, so, I will look for purchases at the level of about 8 600 USD, add to the purchases at the level of about 8 000 USD.
The target is at about 11 200-11 600.
As my analysis is based on the assumption that Spark peak has been formed, and there won’t be another one, one can safely put the stop order at the level of 7 300 USD.
I wish you good luck and good profits!
Regards,
Mikhail Hyipov

If you liked the article, support the author and his project, subscribe to @hyipov and @hyipi
Your support is very important to me!
The original of my article is available at liteforex.com
Disclaimer: No information presented in this article is a guarantee of obtaining a certain return on investment as well as a guarantee of stability in the amount of possible costs associated with such investments. Materials should not be considered as informing about possible benefits. A certain profitability in the past is not a guarantee of profitability in the future. The responsibility for making an investment decision as well as the risks of losses each takes on itself.