Hi folks!
What a weekend!
Last week, we expected Bitcoin price to reach 29k$ and guess what?
https://peakd.com/leofinance/@twoitguys/bitcoin-update-after-the-binance-vs-the-sec-drama
Bitcoin price touched $31,300 Friday, making this the cryptocurrency's highest level since early June 2022. Most commentators suggest that the surge was largely driven by strong signs of increased interest from institutional investors, a key enabler for the cryptocurrency opening the door to general acceptance. (which in my opinion remains to be seen)
Still,several emerging whales are filing applications with the Securities and Exchange Commission (SEC) to set up their own exchange funds with real bitcoins. The world's largest wealth manager BlackRock and its smaller fund rivals Invesco and WisdomTree are in a race to create the first spot Bitcoin ETF in the US.
update: There are currently no Bitcoin ETFs in the US. In contrast, there are only bitcoin futures products in the market. The SEC has previously described these spot BTC ETFs as too volatile and prone to market manipulation. However, the BlackRock ETF promises to monitor and control this risk. How? I have no idea. Is it even possible without transforming crypto into tradFi?
source: coindesk
That been said, let's take a look at the charts, as this still remains the best way to pseudo-forecast crypto.
Daily
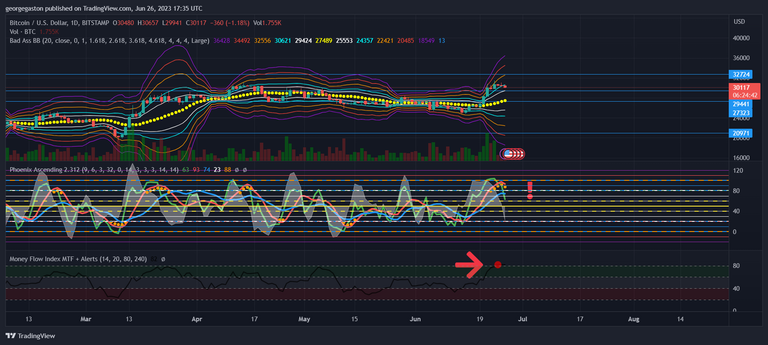
Moving averages are in the BUY zone on the daily charts, and most oscillators are neutral. On the chart, we can see the Money Index Flow at 82 (red dot) telling us we need more liquidity on the short term. This usually indicate a pullback. We are close to the local support at 29 423$. Next support is at 27 488$. 6 hours left to the daily candle, we'll need to see where this one is going, but it's clearly not a good timing for a short. Risks are too high.
Weekly
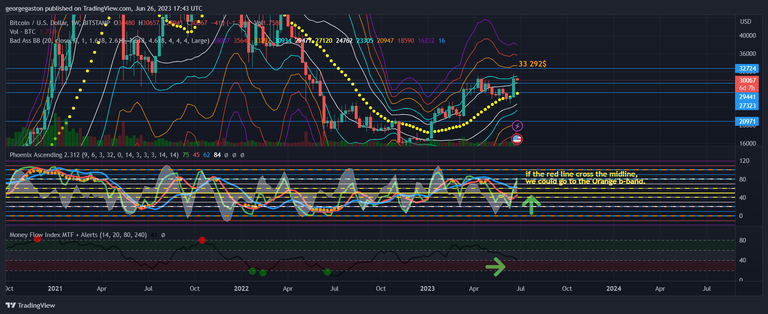
MACD and MA are showing a buy signal. 30 937$ is the first resistance we have to push trough if we want to continue this move upward. As you can see on the chart, if the momentum continue, and the red line pass over the yellow mid-line, we could see Bitcoin go to 33k$. We still have 6 days for this candle and the MFI is going under 41. Be prepare for a move next week or the next few days if the MFI reach 20. It's usually a buy signal.
**Monthly **
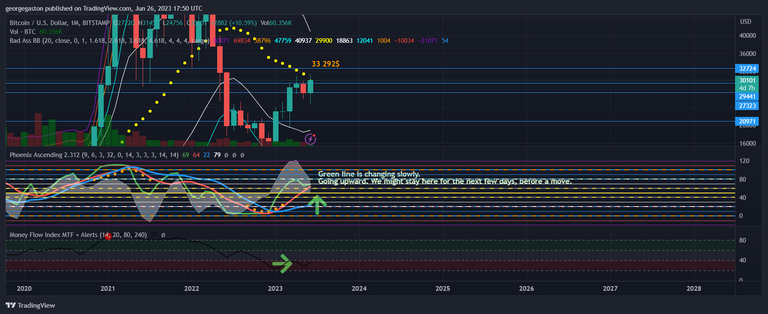
I usually don't do Monthly charts, because of the timeframe and a lot can happen before we see something moving, but this time there's a little fork.
The Green line is changing slowly. Going upward. We might stay here for the next few days, before a move. We'll have to watch the next monthly candle. For now, I just expect action between 29-30k$,but if the money is in, this could change quickly towards 32k$.
Again, nobody can predict the market. We had a few good news which put the retail investors in a good mood, but this can change at anytime because markets are random. Are we in a accumulation phase? But the safest way to trade this is to Dollar-average costing Bitcoin, in the long run you will prevail and stay above the market.
Good luck and good Profits!
GGP
disclaimer : This is just my opinion. Not an expert. Not financial advice. Just for fun. DYOR.