 Saucer or Rounded Bottom Pattern in Bitcoin
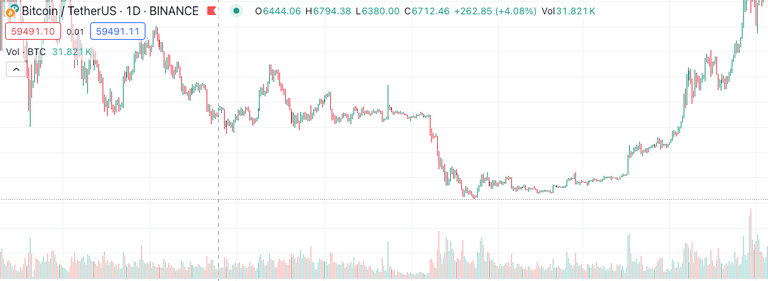
The "rounded bottom" or "saucer" pattern is a chart formation commonly used in technical analysis to signal a potential reversal of a downward trend into an upward trend. This pattern is also referred to as a "bowl" or a "cup" due to its shape, resembling a saucer or a rounded cup-like structure. Here are some detailed characteristics and implications of this pattern:
Characteristics
Formation: The rounded bottom pattern forms over an extended period and represents a gradual shift in market sentiment from bearish to bullish. It typically starts with a slow downward trend, followed by a stabilization and a gradual increase, forming a U-shaped curve.
Volume: Volume plays an important role in confirming this pattern. Generally, volume is higher at the beginning of the formation, decreases as the pattern develops, and increases again as prices start to rise, confirming the reversal.
Duration: Unlike other short-term patterns, a rounded bottom may develop over weeks, months, or even years, depending on the asset and the market context.
Trading Implications
Entry Point: Traders often look for a clear upward movement as the right side of the saucer forms to confirm the trend reversal. A common strategy is to enter a trade when the price breaks above the resistance level that marks the start of the formation.
Target Price: The depth of the saucer can be used to project the target price. Traders typically measure the vertical distance from the bottom of the saucer to the trend line at the start of the formation and project this same distance upward from the breakout point to estimate a target.
Stop Loss: A stop-loss is usually placed just below the lowest point of the rounded bottom or below a support level within the base of the saucer to protect against the possibility of the pattern failing and the price falling back into a downtrend.
Example in Real Trading
In real-world trading, the rounded bottom signals a strong bullish reversal and is often validated by accompanying news or changes in the fundamentals of the asset, which can include earnings improvements, sector recoveries, or broader economic shifts that support the reversal in price.
While the rounded bottom is generally seen as a reliable pattern indicating a bullish reversal, it's important for traders to use this in conjunction with other forms of analysis, including technical indicators and fundamental analysis, to confirm the trend change. The effectiveness of patterns can vary by market conditions and the specific characteristics of the asset being traded.
Understanding and identifying the rounded bottom pattern can provide valuable insights for making informed trading decisions, especially for those looking to capitalize on long-term reversals from bearish to bullish trends.
I call it loss of momentum and it truly is an amazing pattern.