Introduction
Hi Splinterlands family!
This past two weeks I've been busy creating a new tool to give us all fresh insights into the land side of Splinterlands. After some great questions and discussions with fellow fans like @azircon, @aggroed, @mori-no-giant, and @warrentrx, I started building an overview tool specifically for landholders.
I want to mention these names because credit belongs where it's due. I just built the tool around the ideas we talked about—and of course added some of my own touches and ideas along the way.
Can’t wait! Here's the link to the main site:
👉 https://splinter-lands.streamlit.app/
It’s been pretty time-consuming to build, but I’m really enjoying every step.
Quick disclaimer before we dive in
This is a hobby project I’ve been working on in my spare time. It’s hosted on a free platform (Streamlit) and stores historical data on another free service (Supabase). That means there’s always a risk if we hit usage limits (like disk space, CPU, memory, etc). If that happens, I’ll look into alternatives. The tool is still in active development, so expect updates/bugs over time.
If you have ideas for features or notice any bugs or incorrect numbers, let me know in the comments—I’ll do my best to improve things!
What can you do with the current version?
Right now, there are two main pages: one focused on resource metrics and the other on region overview.
Resource Metrics Page
- Do conversion calculations
- See how much your plots produce in terms of resources and DEC value
- Region production overview table showing where you're lacking certain resources
- Charts showing the value of resources over time
Region Metrics Page
- See active land (based on in_use status or production points)
- Total resources across all of Praetoria
- Active vs inactive plots per region
- Production based on raw and boosted PP (overall and per resource)
- Including top-producing regions
- Compare production per region or tract
- Summary:
- Who owns the most plots and how many unique plot owners there are
- Plot breakdowns by rarity, deed, worksite type, status, and boosts in use
- Region production overview with historical trends
Most of the views can be filtered by region, tract, or even just your own plots if you want a more personal breakdown.
In the next chapter, I’ll go over some of these features one by one (not all). I
If you’re eager to explore on your own, here are the links:
🔗 Main Site: https://splinter-lands.streamlit.app/
🛠️ Dev Site: https://splinter-lands-dev.streamlit.app/ – This version gets updates first, but may be a bit more buggy 😉
Resource Metrics Page
Resource conversion
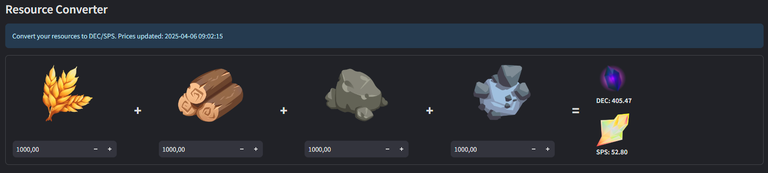
Based on the current land market prices, you can quickly see how much grain, wood, stone, and iron you’d get if you converted between resources.
Got a surplus of grain and need stone? Just plug it in and you’ll see the equivalent based on live prices. Do you want to sell the resource or put it into the trade hub.
Resource Cost & Earnings
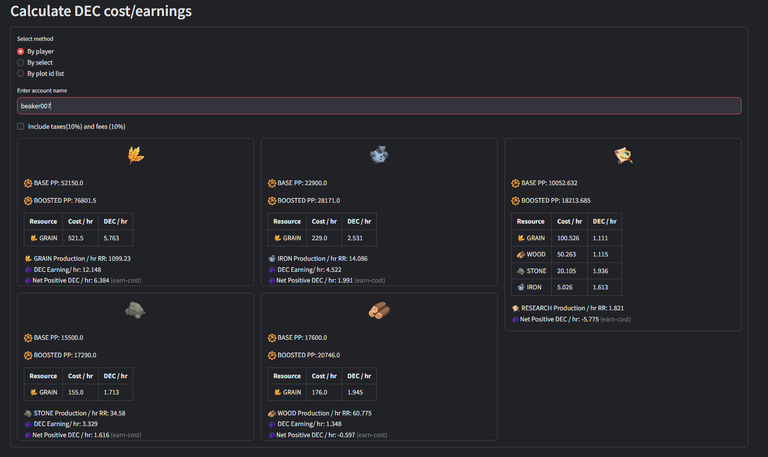
This section lets you dive into how much your plots are producing—and what that production is worth in DEC.
You can enter a username to view all their active land plots and see the resources being generated, along with the associated costs and earnings. Want to zoom in further? You can also select a specific plot from that collection, or just directly enter a plot ID if you’re tracking a particular one.
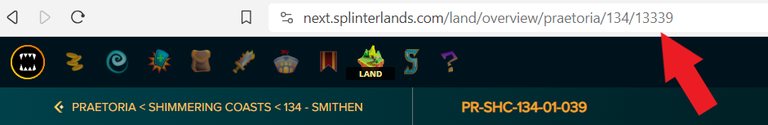
Here you find your plot id in SPL:
It gives you a full breakdown of each resource and its value in DEC, so you can see what's profitable and what might need some tweaking.
There’s also the option to include taxes and fees:
- A 10% tax goes to your region’s castle or keep owner.
- And another 10% fee is calculated if you're selling your resource for DEC.
Region production oveview
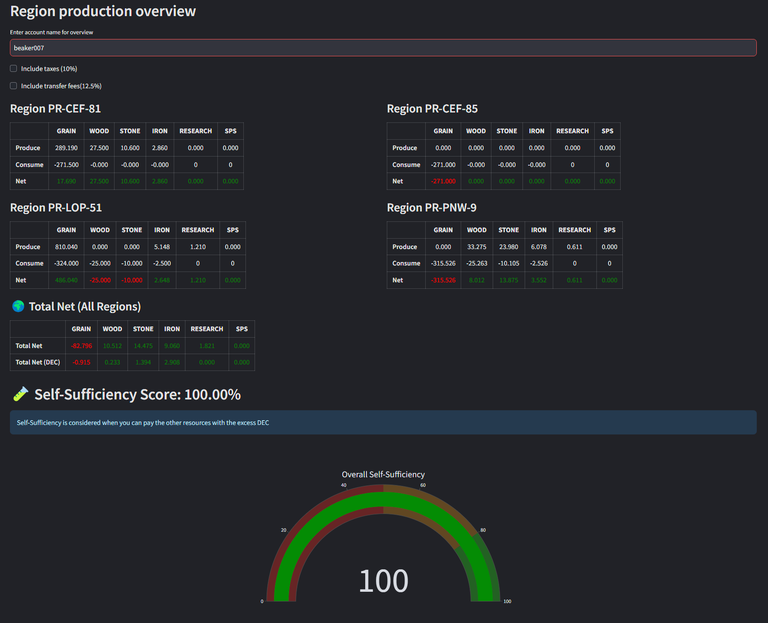
This view gives you a regional breakdown of all the resources produced by a specific user’s plots. It’s super useful if you want to see whether your land setup is running at a surplus—or if you’re falling short on certain resources.
You’ve got a few toggles to help paint a clearer picture:
Taxes: When enabled, this applies the standard 10% cut that goes to the region’s castle or keep owner.
Transfer Fees: If your plots are spread across multiple regions and you're short on a resource in one of them, a 12.5% fee is added to simulate transferring it in from another region (instead of buying it from the market).
And one of my favorite bits here is the Self-Sufficiency Score.
If you’re running a deficit on one resource but making up for it with a surplus in another (based on their DEC value), the tool calculates whether you’re still operating self-sufficiently overall. A positive score? You're good. A negative one? You might want to rethink your layout or production boosts.
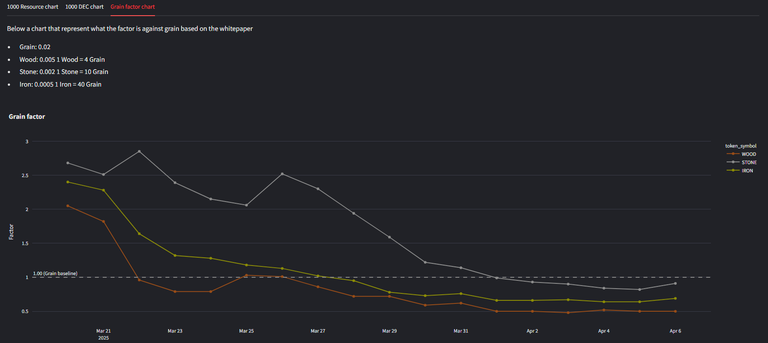
Region production oveview
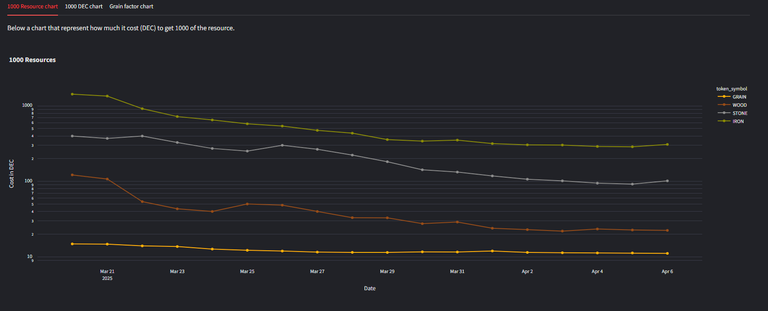
At the bottom of the region production page, you’ll find a set of charts showing the historical value of each resource. These give a great snapshot of how the market has shifted over time. There are three charts included:
- 1000 Resource Cost – Shows how much DEC it would cost to buy 1000 units of a specific resource. (Y-axis is on a log scale.)
- 1000 DEC Conversion – Displays how much of each resource you’d get for 1000 DEC (about $1). (Also in log scale.)
- Resource Factor (vs Grain) – This compares each resource’s value relative to grain, acting as a sort of “resource factor.”
A good rule of thumb here:
If a resource’s line is below grain, it might be worth holding or trading on the hub.
If it’s above grain, it could be a good opportunity to sell.
These charts can help you make smarter decisions on what to produce, hold, or offload.
Region Metrics Page
Note this information is updated once per day.
Overall information
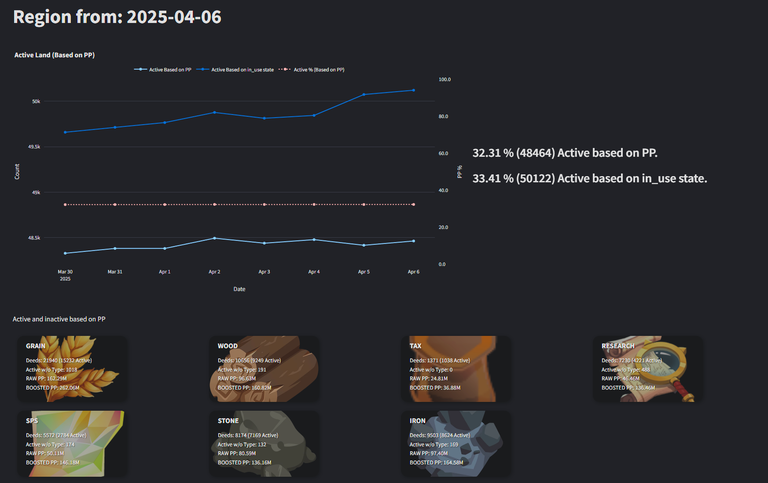
At the top of this page, you’ll find a quick summary of how many active plots there are across the land.
There are a couple of ways “active” is measured:
- In Use – These are plots marked as in_use by Splinterlands. This usually means something is staked on them, like cards or titles—but not necessarily producing, since DEC isn’t staked.
- Active by Production Points (PP) – These are the plots that are actually generating resources. Personally, I see these as the truly active ones.
Below that, you’ll find a set of overall stats for each resource, giving you a clear view of total production across Praetoria.
Active Overview
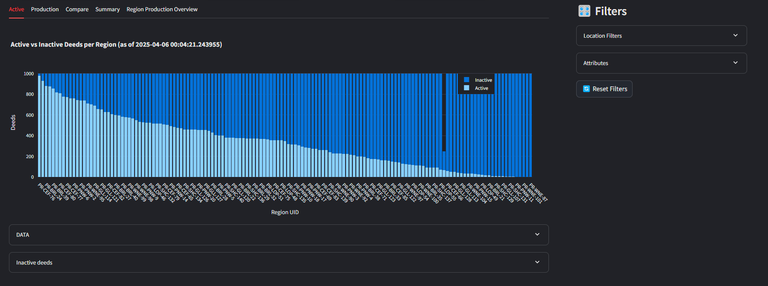
This chart gives a nice and clear visual of which regions have the most active plots, based on Production Points (PP).
It’s a quick way to spot where the action is happening—whether you're curious about your own region or just want to see which areas are the most productive in all of Praetoria.
Production Overview
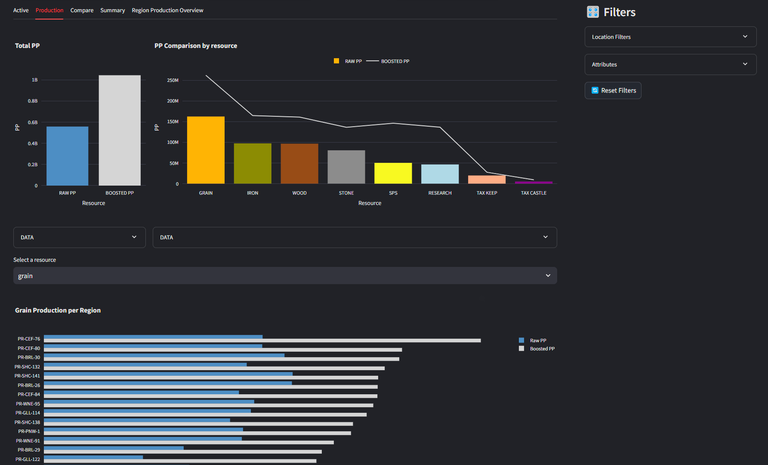
This section shows the overall raw Production Points (PP) versus the boosted PP, giving you a sense of how much your boosts (like totems, buildings, and boosts from titles/cards) are making a difference.
You’ll also see which resources are being produced the most—either across all of Praetoria or filtered down by region or type.
At the bottom, there’s a ranked list showing which region is producing the most boosted PP for each specific resource. It’s a great way to spot the top-performing regions and understand where the resource hotspots are.
Compare
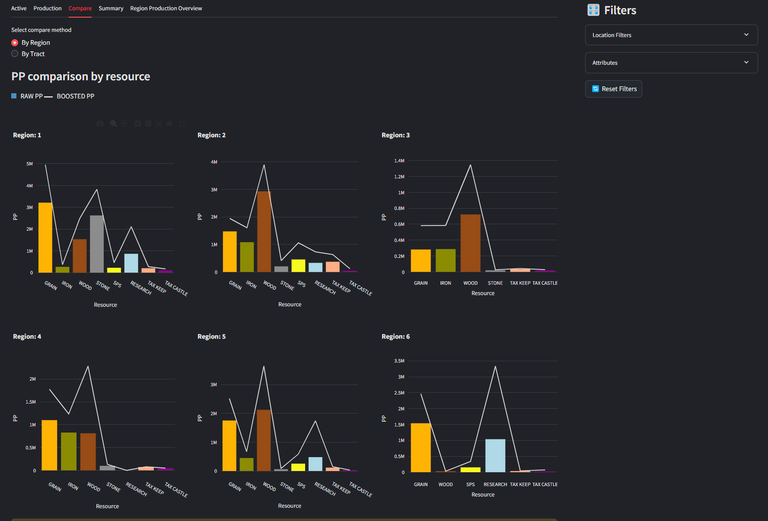
While the previous screen showed total production across the board, this view lets you compare regions or tracts side by side.
It’s a great way to spot imbalances—like one tract producing tons of stone but lacking in grain, or one region being much more efficient overall than another.
You can use it to dig deeper within a region, or stack entire regions against each other for all resource types. Super handy if you're planning trades, boosting strategies, or just love data like I do!
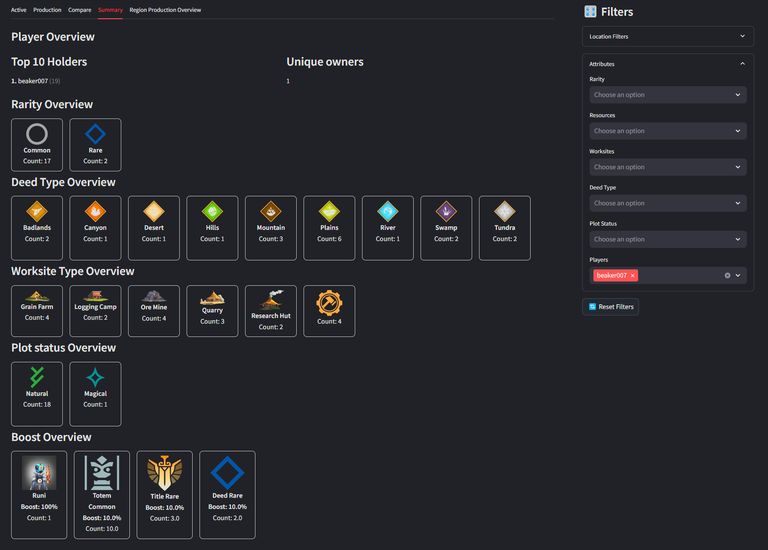
Summary
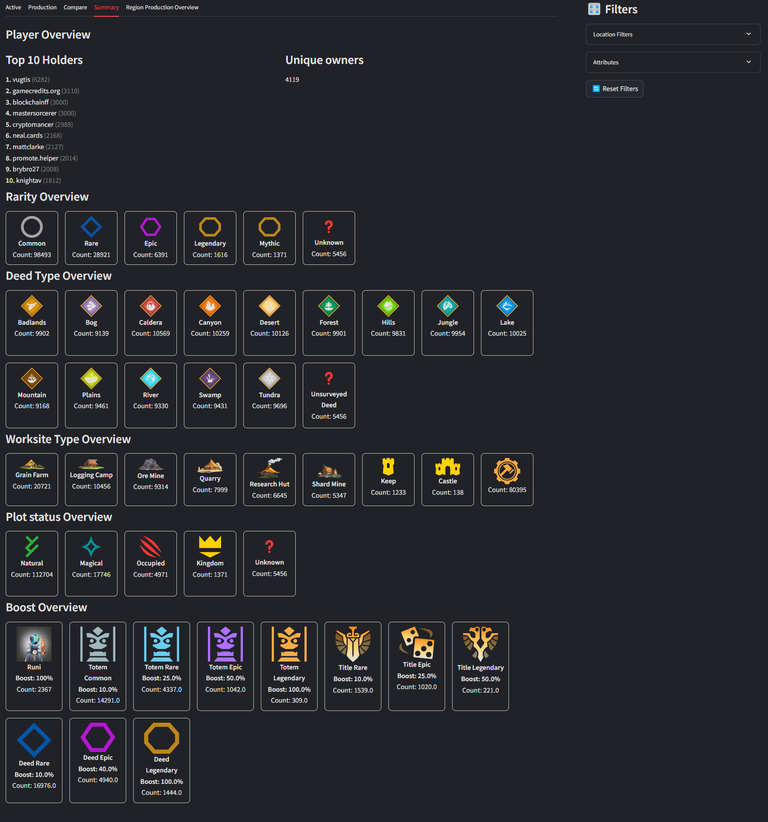
This section is a bit more relaxed—focused on fun stats and general land ownership info.
You’ll get insights like:
- How many plots exist overall or in a specific region
- Rarity breakdown of those plots (Common, Rare, Epic, Legendary)
- How many are boosted with Runi, titles, totems, and other bonuses
- You can also check out a leaderboard of the top landowners across Praetoria.
And here's a cool one: if you select a specific tract, you can see how many unique users are around you—just to get a feel for your landowner neighborhood 😉
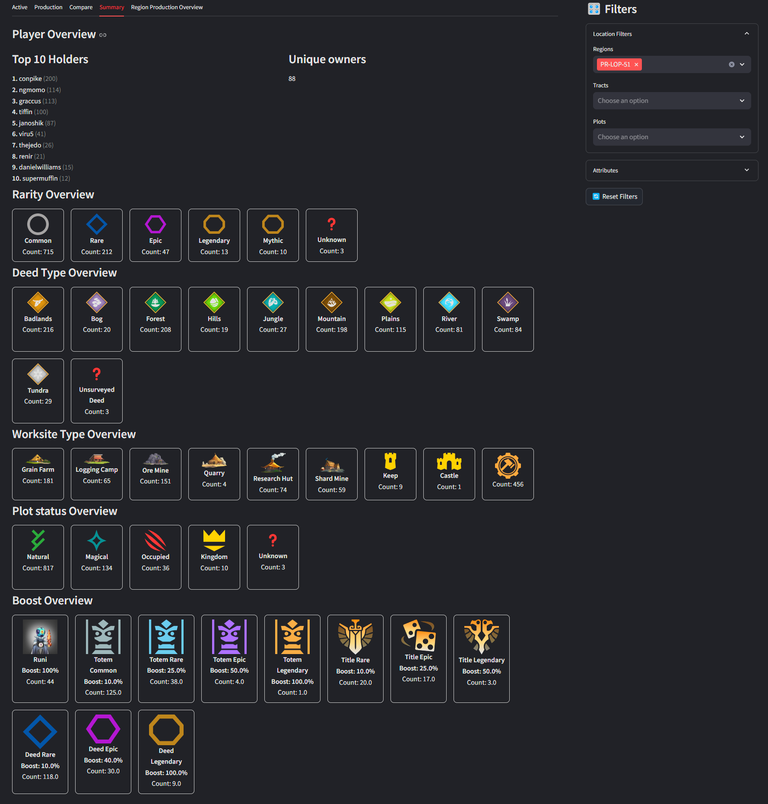
Again all the above chapter do react on the filter you can filter on location (region/tract/plot) or attributes:
Region Production Overview
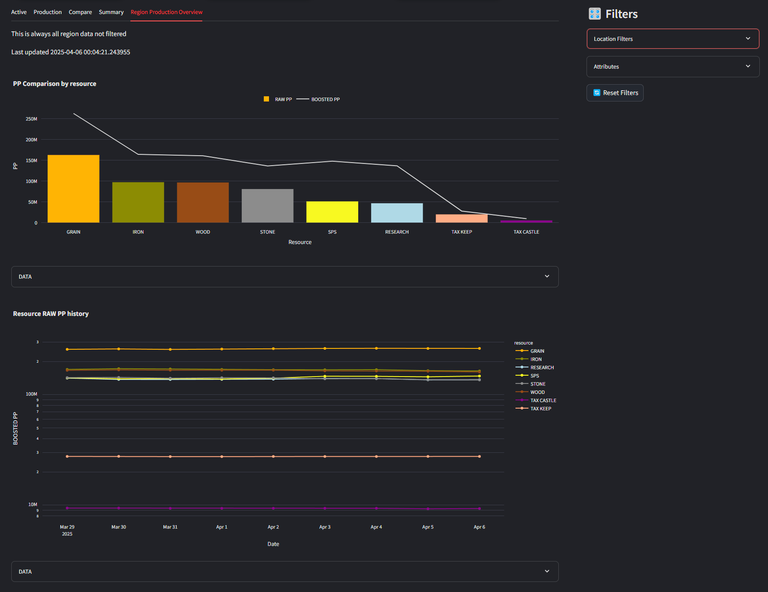
Last but definitely not least—we've got the overall region production overview.
This one doesn’t apply any filters, so it gives you a clean, big-picture view of what’s happening across all regions. You can quickly spot which resources are being produced the most, and how that balance shifts over time.
It also keeps a history log, so you can track trends and changes in region production as the game evolves.
Perfect for those of us who love looking at the big data picture!
Closing notes
There you have it—a tool already packed with data and insights to explore!
I’ve genuinely loved building this, even though (as always) it’s taken a bit more time than expected 😅. Still, I hope you all find it useful, fun, and maybe even a bit addictive to play around with. If you have any ideas, feedback, or spot something odd, don’t hesitate to drop a comment—I’d love to hear from you!
What’s next?
There’s still plenty I want to add in the future, like:
- Player-specific dashboards – See all of a player’s plots, staked cards, and production in one place.
- KOM (King of the Mountain) – A leaderboard highlighting the best castles and keeps in terms of tax income. You’ll be able to see which regions or tracts generate the most revenue and who’s sitting on top of the land economy.
As usual, it’s an open-source tool, so if you want to peek under the hood or contribute, feel free to check out the code here:
👉 https://github.com/gamerbeaker007/splinter-lands – for all the Python lovers out there 🐍💻
Thanks again for checking it out, and happy land lording! 🌍💰
![]()
Do you also want to be part of this amazing play to earn game consider using my referral link.
Great post! You are definitely taking your posting on Hive to another level!
Thaks @seattlea, keep improving 🤣.
This is such an awesome tool! Thank you so much for developing this. I will use this a lot. Like.... a lot!!
The part where it calculates the requirements and yield of a single plot - so useful!
I usually do spreadsheet math on this and I'm glad there's a better way to look at this now.
Thanks, glad you like it 😍
Wow, that's super nice work, very useful!
Thanks 👍
Hope to use this tool someday. I currently have 2 plots and planning to have 3 more so that it will have an impact on my brawls. thanos for this and keep up the great work @beaker007.
Someday you will... slow and steady increase is a valid strategy.
OW YES!!
For me this is the main stat I was exactly looking for. As only a 2 plot owner I don't do a lot of zapping back and forth but these prices in a graph are just what is starting to make sense. You need data to compare, and this at least gives the trend.
Love and wow...kudos for all the work you have put in, people will love this!
Yeah this is also one of my favorites. curious how it will relate when there is more land online.
Can't wait to check this properly when I get home, but it seems this is just what I wanted since I started paying more attention to land. Thanks a ton!
Let me know if you run into problems 👍
I will; thanks again!
Blimey, I am so glad you were one of the original 'Leeching Arseholes'.., 😀
🤣🤣 yeah remember that day...
These are some of the most unique set of tools available for Splinterlands. Many thanks to your hard work that all players, big and small, can see the relevant data visually and then make informed decisions
Thanks @azircon,
Tools enough with spl and hive 🤣. Love the open source and api community, my contribution of giving something back to the community.
How is this game not another scam. Is it? Honestly . Tell us how its not a scam . Do stake holders actually own the game in anyway? Its just aggroeds perspnal game world right? Or do u have any say? Like explain to a harsh critic
Defend your scam
What to say to this... if you think it's a scam stay away from the project.
I'm here because I like the game, main part the card strategie.. Land is not in it's full glory, so a bit boring for me now, but it's growing. I like the data sight of it already as you can see in my post.
The dao has some say in how things are handled in terms of token distribution. And can recommend game changes. Stake weighted votes. SPS validation is now down decentralised with their own nodes.
I only spend my entertainment budget, don't see it as a money making machine. I will be honest green portfolio would make it even more fun.
Aggroed is no longer running the company, also do not think he was in it to scam others imho....
The community is one of reason which I enjoy my stay here... weekly voice discussion about the game where often also team members are around the table. They definitely not only sugar coating the company also critical... they do not have to do that so I see them part of the community.
What are your arguments, why is this a scam. And why did they not run with all our cash back in 2021....
Thanks for sharing! - @azircon

https://bsky.app/profile/did:plc:4lwwxlwc7pemlctzbxjkcm6d/post/3lm5nwwsult25
https://bsky.app/profile/did:plc:4lwwxlwc7pemlctzbxjkcm6d/post/3lm5nwwsult25
The rewards earned on this comment will go to the author of the blog post.
#hive