
Welcome to the daily financial report about the Hive blockchain.
All the information presented in this report is based on the data collected from the blockchain until 2022-03-15 midnight UTC. This report aims to provide you with a clear view of what is happening on the Hive blockchain.
 Este post está traducido al español - aquí
 Dieser Beitrag ist ins Deutsche übersetzt - hier
 Une version en français de ce post est disponible - ici
1. Price
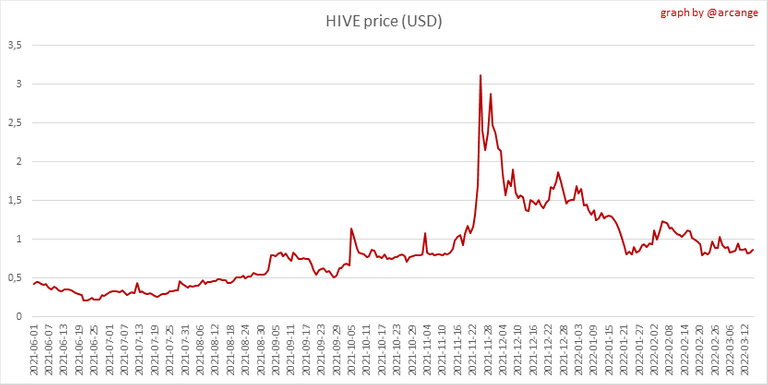 | 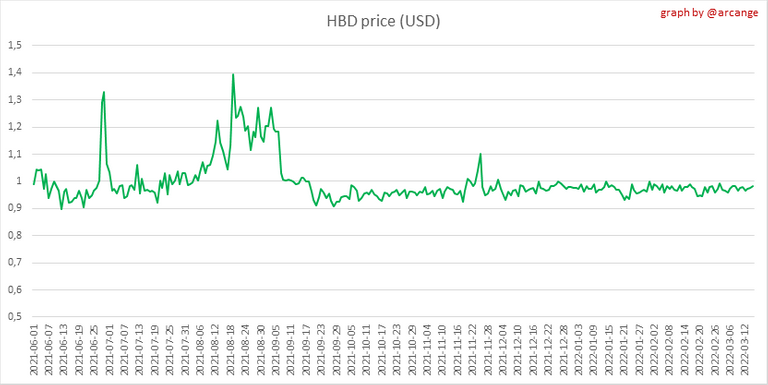 |
These graphs show the evolution of prices in USD for HIVE and HBD.
2. Supply
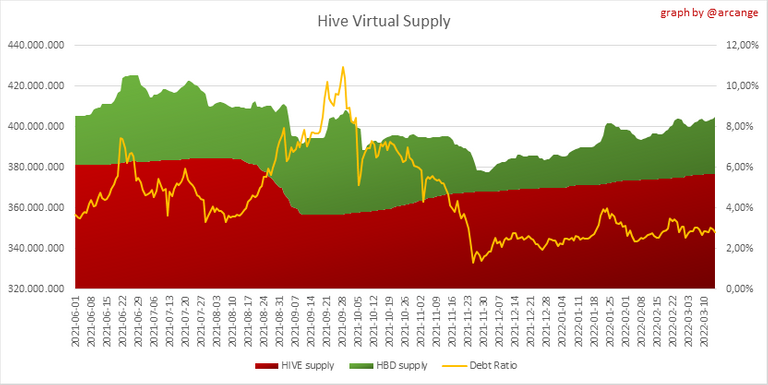
This graph shows the evolution of HIVE virtual Supply. The virtual supply is the sum of HIVE supply (liquid and staked HIVE) and HBD supply (converted into HIVE).
The graph also displays the debt ratio (HBD supply / HIVE virtual supply). Keep in mind that since hardfork 24 funds in the treasury (@hive.fund HBD balance) don't count towards the HBD debt ratio.
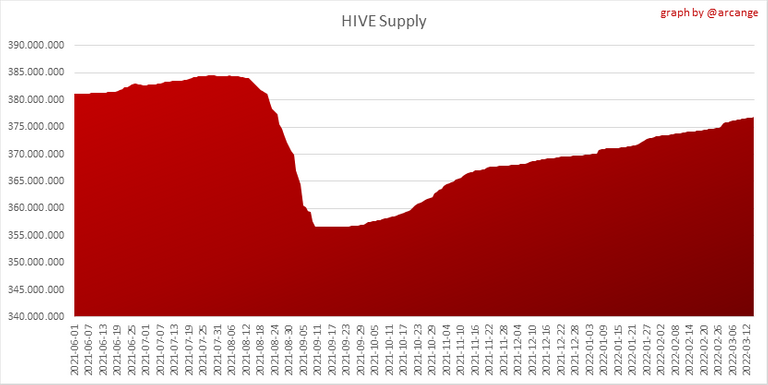 | 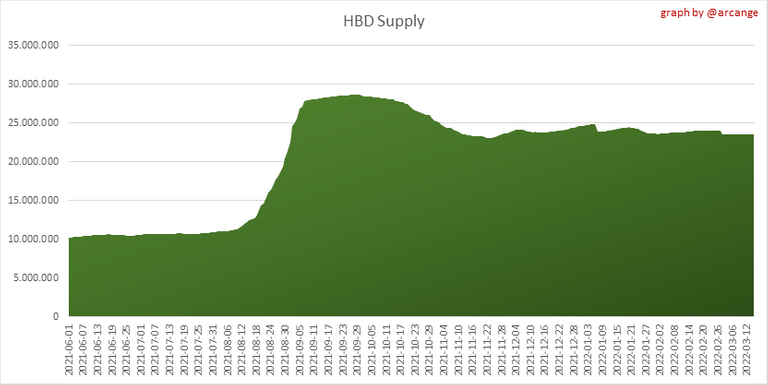 |
These graphs show the evolution of the HIVE Supply (both liquid and staked) and the HBD supply.
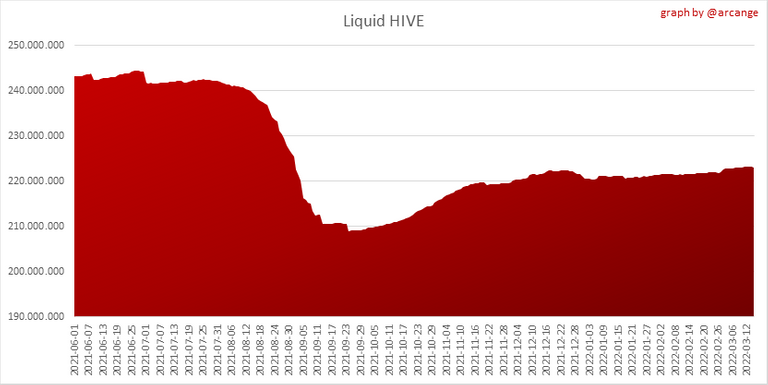 | 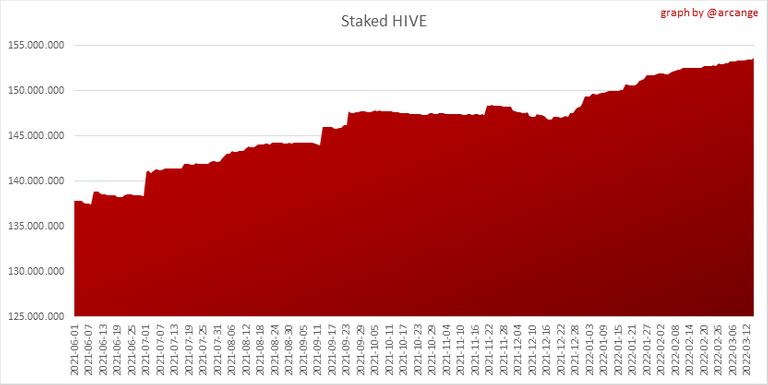 |
These charts show the evolution of the liquid HIVE and the staked HIVE (Hive Power).
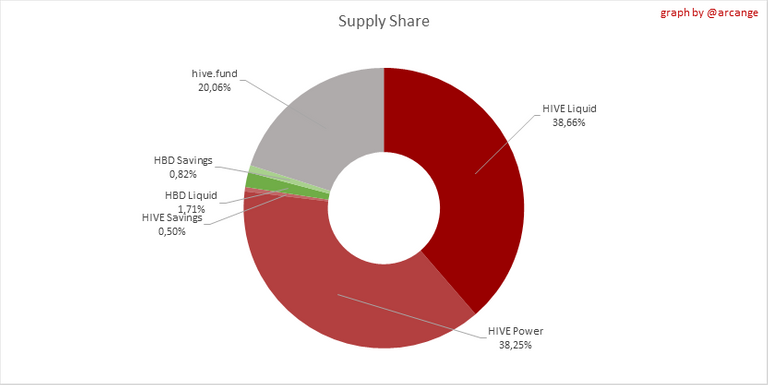
This graph shows the overall Hive tokens distribution.
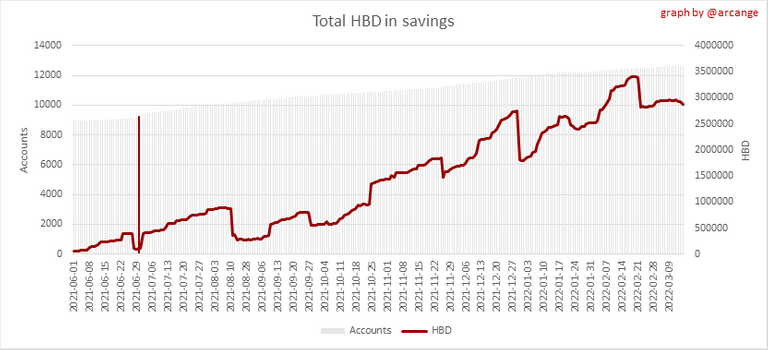
3. HBD Savings
| Account | Deposit | Account | Withdrawal |
|---|---|---|---|
| @calimeatwagon | 793.516 HBD | @erode | 400.673 HBD |
| @justinparke | 356.422 HBD | @condeas | 325.965 HBD |
| @hiveauth | 324.984 HBD | @alokkumar121 | 307.000 HBD |
| @rishi556.engine | 296.298 HBD | @jenesa | 200.000 HBD |
| @hivechain.app | 189.984 HBD | @elemarg25 | 104.466 HBD |
| @martibis | 141.000 HBD | @petreius | 22.000 HBD |
| @kenny-crane | 127.335 HBD | @forsakensushi | 11.980 HBD |
| @akipponn | 104.276 HBD | @farm-mom | 10.463 HBD |
| @elemarg25 | 100.000 HBD | @eylz619 | 10.007 HBD |
| @thegaillery | 100.000 HBD | @ligayagardener | 10.000 HBD |
This graph shows how much and how many accounts store HBD in savings. The table below shows the topmost HBD deposits and withdrawals of the day.
Note: As of 2021-06-30 (HF25) interest is only paid for HBD which are stored in savings.
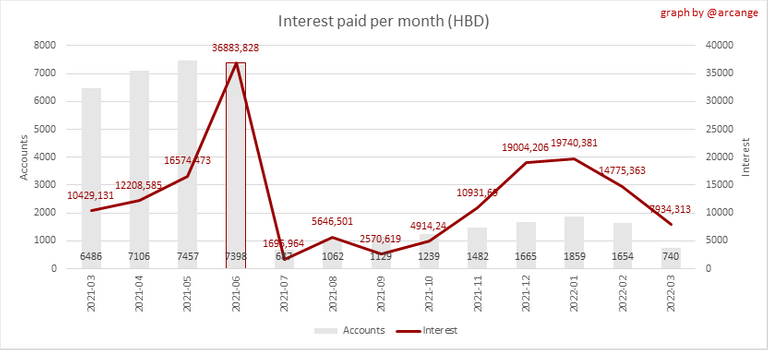
This chart shows the amount of interest paid each month for holding HBD and how many accounts received such interest.
4. Balances
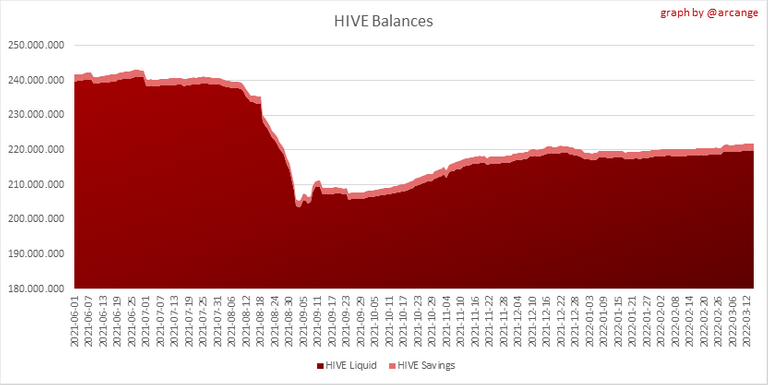
This graph shows the number of HIVE, both liquid and in savings, held by all accounts.
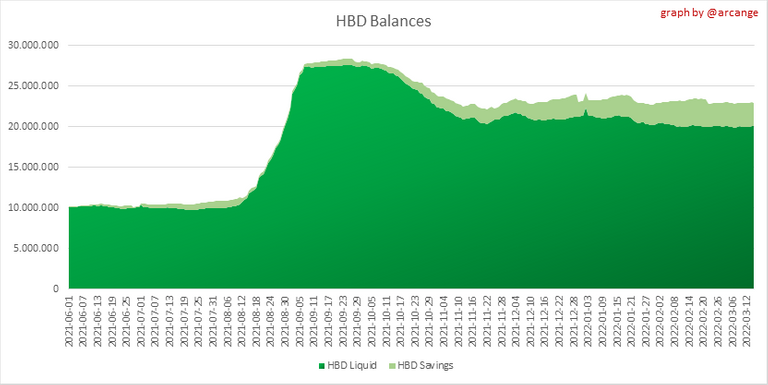
This graph shows the number of HBD, both liquid and in savings, held by all accounts.
5. Conversions
Note: As a reminder, conversion requests are only finalized after 3 days. It is only then that it is known exactly how many HIVE were burned in return for the HBD received at the time of the conversion request.
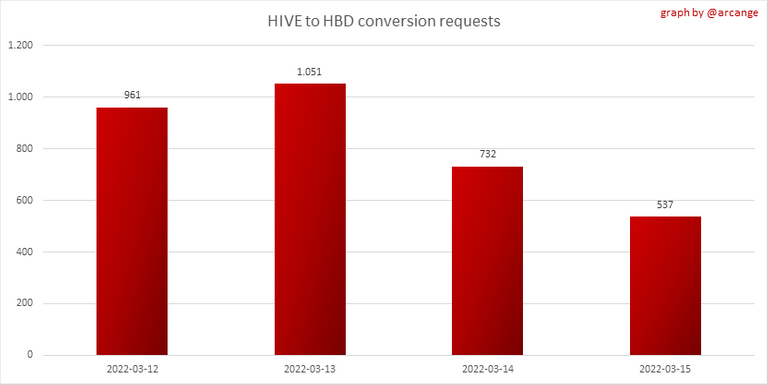
This graph shows the number of HIVE collateralized due to requests to convert HIVE to HBD over the past few days.
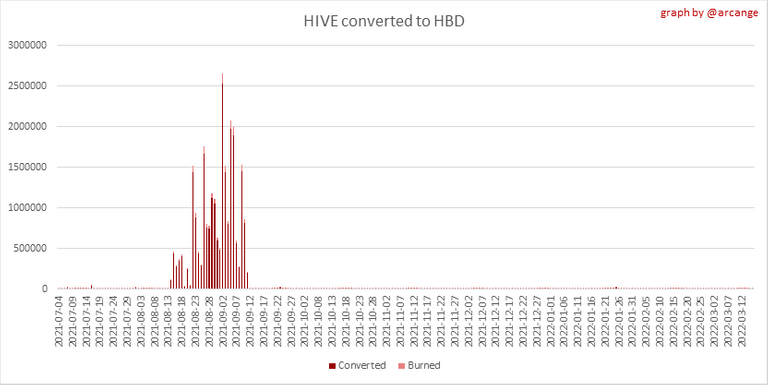 | 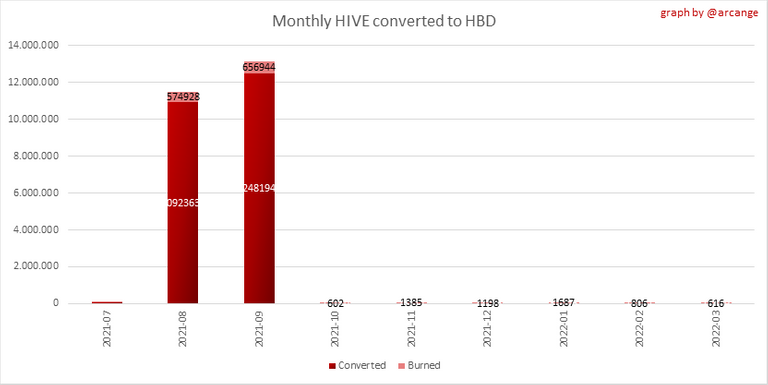 |
These graphs show the number of HIVE effectively used by the conversion process (HIVE converted and 5% HIVE fee which is burned) each day and month when requests to convert HIVE to HBD have been finalized.
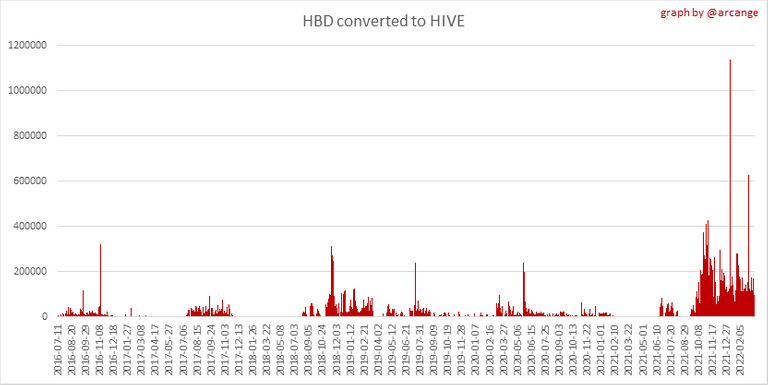 | 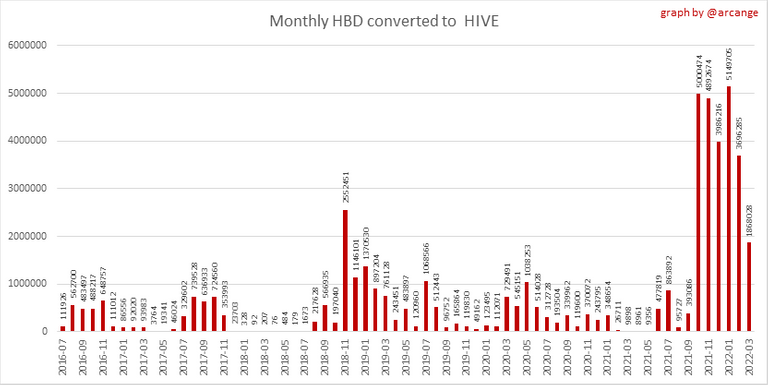 |
These graphs show the number of HBD burned, each day and each month, following requests to convert HBD to HIVE.
6. Powerup and Powerdown
| Date | Account | Amount |
|---|---|---|
| 2022-03-15 09:28:30 | @revisesociology | 24,000.918 HIVE |
| 2022-03-15 04:16:09 | @upmewhale | 4,864.612 HIVE |
| 2022-03-15 07:52:18 | @xels | 4,600.381 HIVE |
| 2022-03-15 08:39:06 | @lisfabian | 4,432.949 HIVE |
| 2022-03-15 04:57:30 | @djsl82 | 4,185.668 HIVE |
| 2022-03-15 11:59:33 | @alexsandr | 2,306.857 HIVE |
| 2022-03-15 02:39:09 | @cuongnhung | 1,453.279 HIVE |
| 2022-03-15 11:01:42 | @surrealfia | 1,452.325 HIVE |
| 2022-03-15 06:17:39 | @mayifiestas | 1,376.986 HIVE |
| 2022-03-15 04:15:06 | @team | 1,295.100 HIVE |
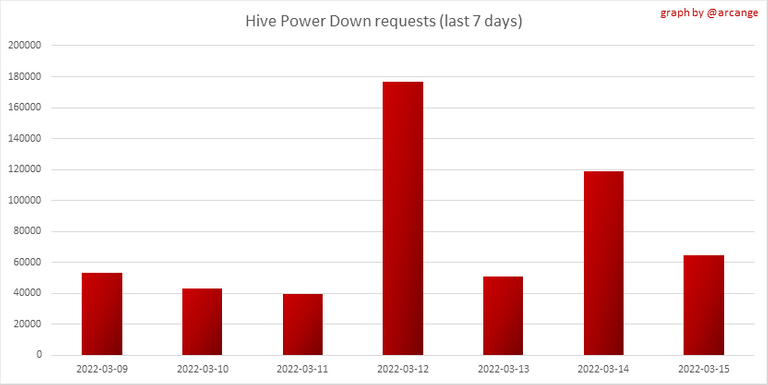
This graph and table show the amount of powerdown initiated over the last 7 days, and the largest initiated on this day.
| Account | Powerup | Account | Powerdown |
|---|---|---|---|
| @lazy-panda | 223,991.475 HIVE | @dhenz | 23,200.324 HIVE |
| @galenkp | 10,000.000 HIVE | @wagginston | 7,884.545 HIVE |
| @gregory-f | 4,000.000 HIVE | @seeyouinlumb | 4,230.695 HIVE |
| @ismelda2305 | 2,951.405 HIVE | @leo.voter | 2,432.585 HIVE |
| @jphamer1 | 2,185.026 HIVE | @good-karma | 2,391.356 HIVE |
| @ecoinstant | 1,300.000 HIVE | @ausbitbank | 1,011.152 HIVE |
| @criptosectadepit | 764.225 HIVE | @vancouverpics | 941.462 HIVE |
| @gleam-of-light | 642.469 HIVE | @mm100 | 872.052 HIVE |
| @blrog | 524.163 HIVE | @allmonitors | 617.405 HIVE |
| @patsitivity | 495.902 HIVE | @steem-engine | 597.038 HIVE |
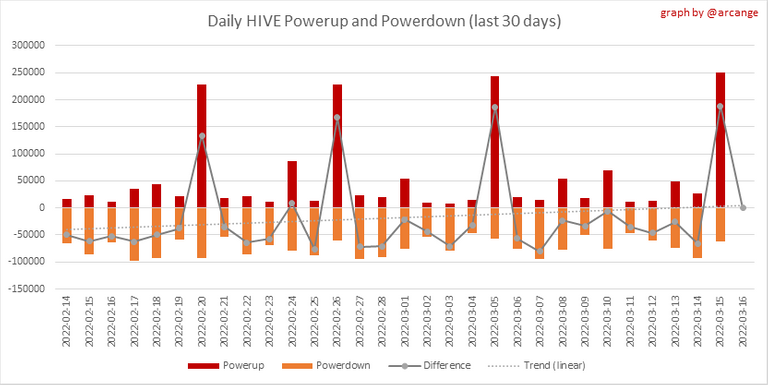
This graph shows the daily HIVE power-up, power-down, and the resulting variation over the last 30 days. The table shows the topmost power-ups and power-downs of the day.
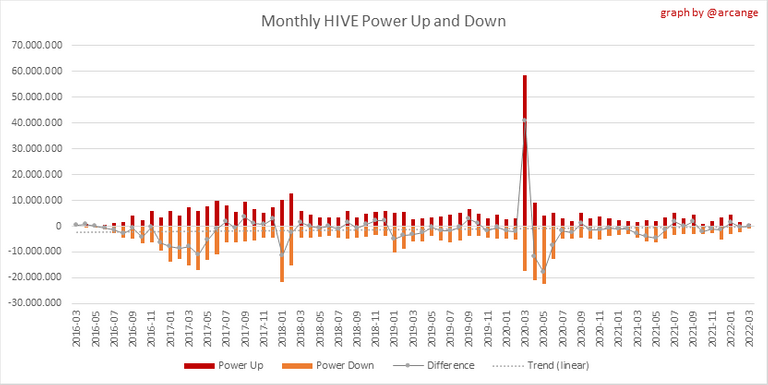
This graph shows the monthly HIVE power-up, power-down and the resulting variation.
Values for the last 3 months
| Period | Powerup | Powerdown | Difference |
|---|---|---|---|
| 2022-03 | 853,339.000 | 1,019,101.000 | -165,762.000 |
| 2022-02 | 1,749,531.000 | 2,228,644.000 | -479,113.000 |
| 2022-01 | 4,573,937.000 | 3,082,577.000 | 1,491,360.000 |
7. Transfers
These graphs show the volume (in USD) of HIVE and HBD transferred between accounts.
8. Exchanges
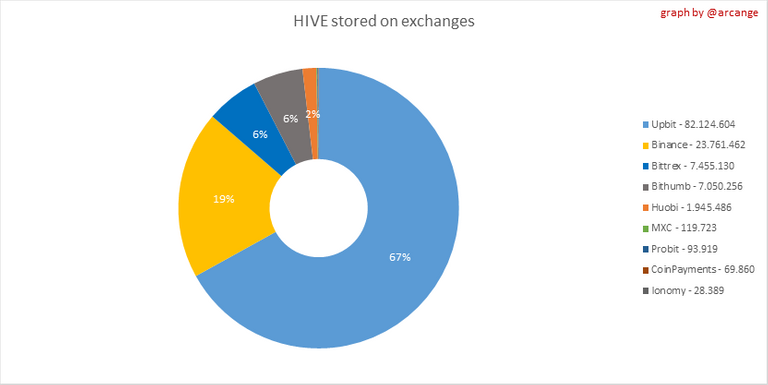 | 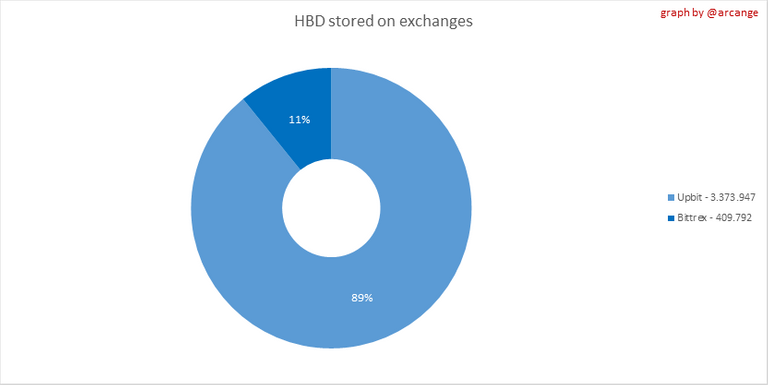 |
These graphs show the amount and distribution of HIVE and HBD stored on the exchanges where they are listed.
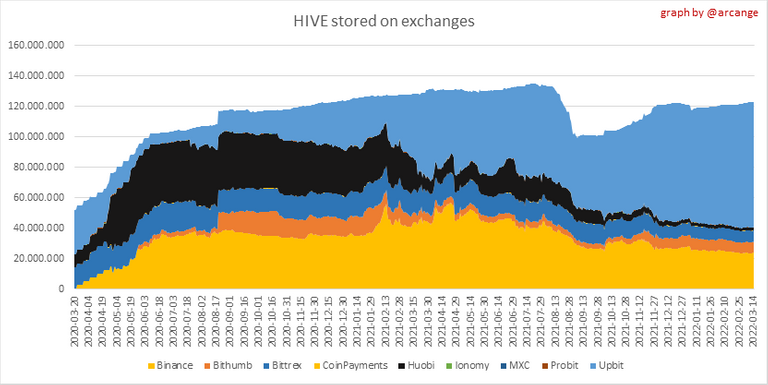 | 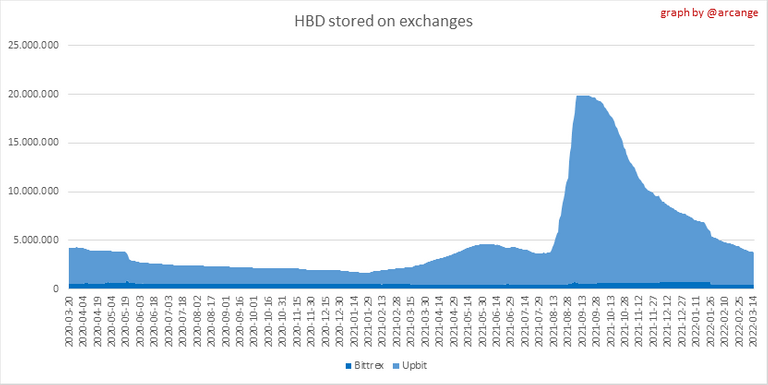 |
These graphs show the daily evolution of HIVE and HBD stored on the exchanges where they are listed.
I hope you find those stats useful. If you would like to see additional stats, feel free to drop me a comment. Your feedback is than welcome.
Thanks for reading.
Check out my apps and services


View or trade
BEER.Hey @arcange, here is a little bit of
BEERfrom @pixresteemer for you. Enjoy it!Learn how to earn FREE BEER each day by staking your
BEER.I see my name in the HBD Savings table. I like the 12% interest on HBD. Seems to be a hedge against inflation which is running at around 8%. I feel that HBD is stable enough so that one has little to worry about loss of principal. So I add to my HBD Savings whenever I can!
Thanks for all this data. It is helpful.
Yes, these 12% are really tempting 🤑
The rewards earned on this comment will go directly to the person sharing the post on Twitter as long as they are registered with @poshtoken. Sign up at https://hiveposh.com.