How is the second layer solution on Hive doing during these times? Is more Hive deposited or withdrawn from it. Let’s take a look.

Hive Engine is now an OG when it comes to Hive and L2. It has been around since 2019, six years now, and has enabled a lot of projects to be built on top of Hive. While not perfect, its existence has been a very important tool in the Hive ecosystem.
Splinterlands and its tokens and pools are the main ones that drive most of the volume on Hive Engine but there are a lot of other apps. Gaming tokens seem to be growing more and more these days.
Here we will be looking at the volume that Hive Engine does in terms of deposits and withdrawals on the platform. It is a nice indicator of the state of the platform.
At the moment there are three major gateways for deposits and withdrawals on Hive Engine:
- Hive Engine (@honey-swap)
- BeeSwap (@hiveswap)
- Uswap (@uswap)
The fee for deposits and withdrawals on Hive Engine is 0.75%, while on Beeswap and Uswap fees are lower and it depends on the liquidity, and if you are converting in a direction with lower liquidity you can be even rewarded with more HIVE/SWAP/HIVE tokens.
Deposits
For deposits we will be looking at the transfers to the Hive Engine: @honey-swap account, @hiveswap and @uswap.
Here is the chart.

The chart is on monthly basis.
We can notice the spike in the monthly deposits back in 2021 when in the period of August to November 2021 there was a lot of volume, reaching 8M HIVE deposited in one month.
In recent months the volume for deposits is around between 2M and 3M HIVE per month.
January 2025 and the previous months have increased in deposits reaching more than 3M.
Withdrawals
Next the withdrawals. Here is the chart for the daily withdrawals.
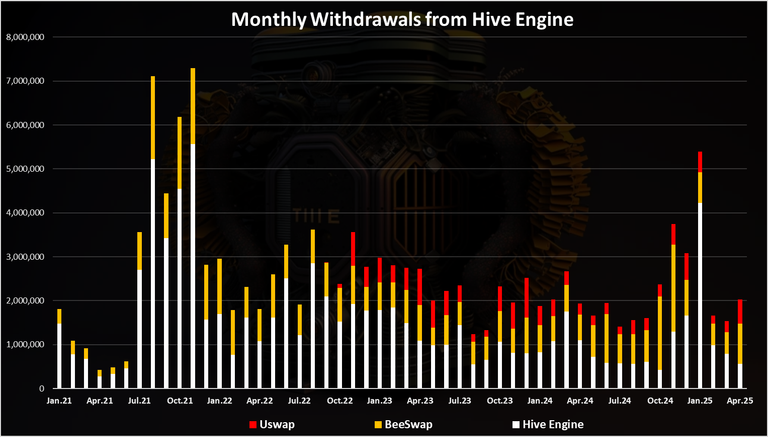
A similar pattern as for deposits, a peak back in 2021 and somewhat steady numbers up until January 2025 when there is a spike in the withdrawals up to 5M.
Total Volume per Month
If we take both the deposits and withdrawals and sum them up on a monthly level, we get this.
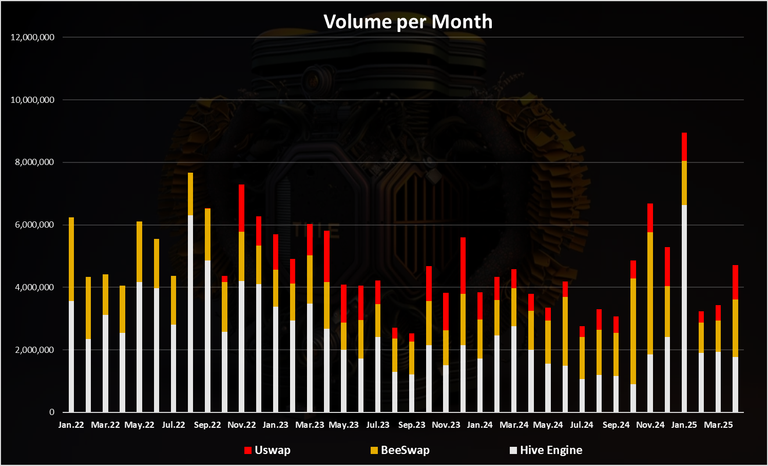
This chart starts from 2022 for clearer presentation.
We can notice the downtrend in 2023, but in the last months there seems to be a reversal. A peak in January 2025 with more than 8M in volume.
Individual Platforms Share
Here is the chart for the share of the deposits of Hive Engine, BeeSwap and Uswap.
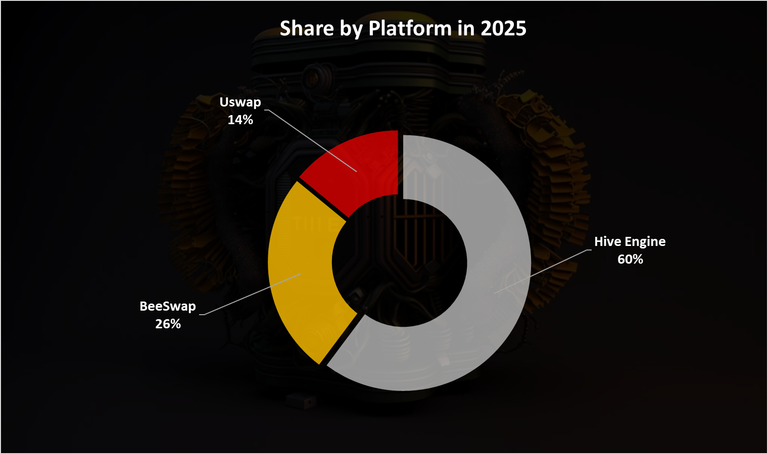
Hive Engine is on the top here with 60% share in 2025. Previously in 2024 BeeSwap was leading on some occasions, but when the volume increases, Hive Engine has the most liquidity to serve higher volumes. BeeSwap and Uswap usually handle lower volumes.
HIVE Supply on Hive Engine
Here is the chart for the HIVE stored on Hive Engine.
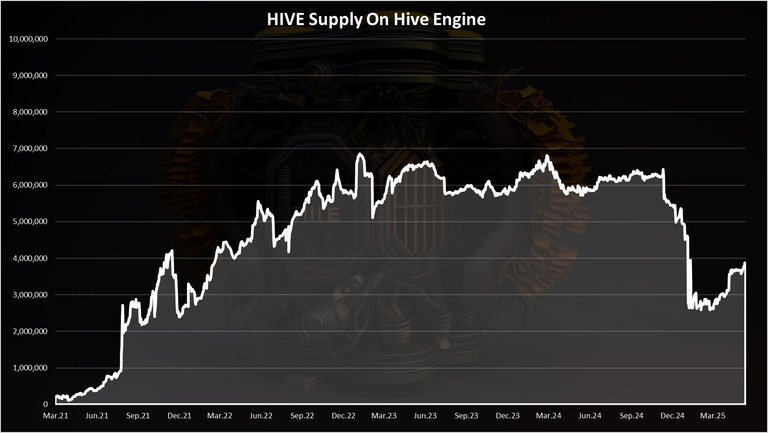
As we can see prior to June 2021 there was under 500k HIVE deposited on Hive Engine. Then it started to grow and with a few dips on the way, it grew almost constantly to almost 7M at the end of 2022. A somewhat sideways action since then, up until January 2025 when there is a lot of HIVE withdrawn.
This happened because there was some funding rate on Binance due to high APR for HIVE there, and some users have made loans to farm the difference. As stated in the comment of this post these funds are not users funds, but on privately owned by aggroed.
In the last month there has been a small increase in the funds again.
Top Pools
Here are the top pools:
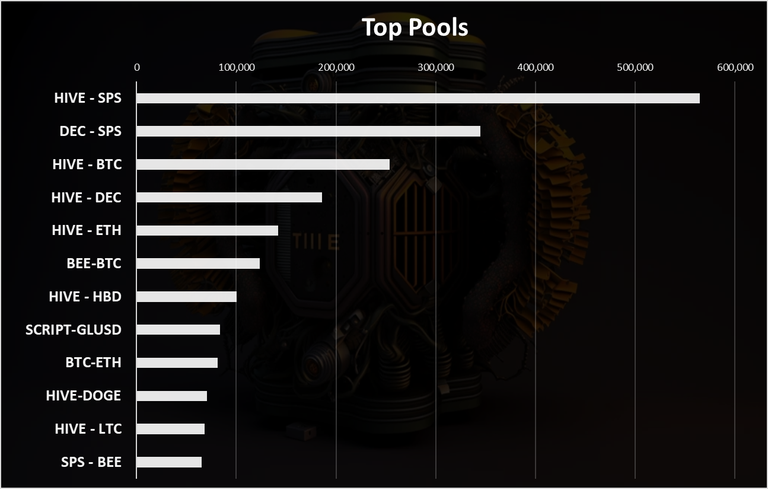
As we can see the top pool is Splinterlands related, SPS-HIVE, then another one SL pool, SPS-DEC, and then comes HIVE-BTC and HIVE-ETH.
Its interesting that BTC and ETH are now quite high in the pools, as top cryptocurrencies. Some other coins there as LTC, DOGE, and mostly Splinterlands tokens in the top.
In terms of TVL in pools Hive Engine has been around 3M USD.
Monthly Number of Accounts Making Deposits or Withdrawals
This can be seen as the number of users on HE but limited only to deposits and withdrawals on HIVE. Accounts making only swaps and inner token transactions are not included.
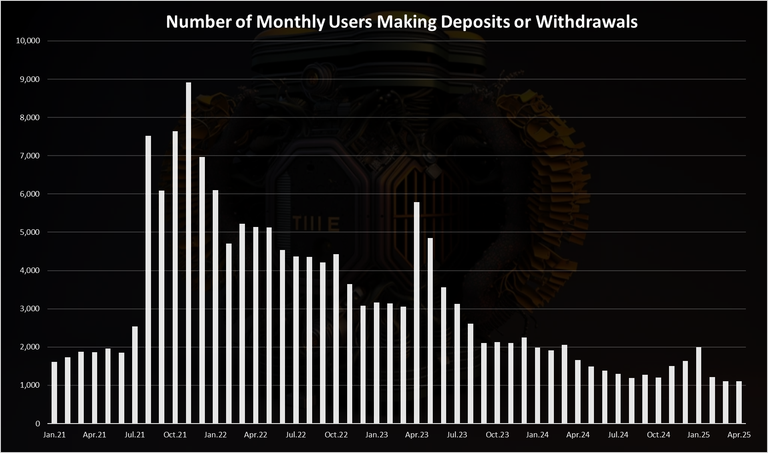
The ATH for number of accounts making deposits and withdrawals was reached back in November 2021 with 9k accounts making transfers. Since then, there was constant decline with a spike in April 2023, and a drop since then to 1.2k in August 2024. In the last months of 2024, there was a small increase in the MAUs, reaching 2k in January 2025, and dropping back again to around 1200.
Top Accounts that Deposited
Here is the chart for the top accounts that deposited in 2025 up until now.
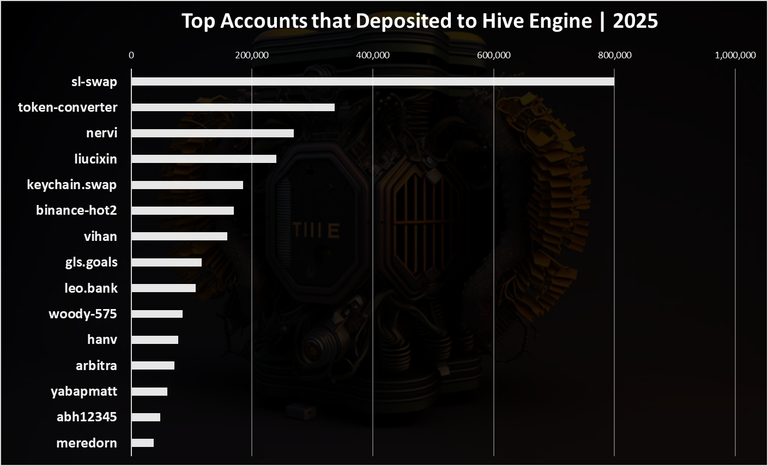
The @sl-swap account is on the top with more than 800k HIVE deposited in the period. This is an account that is connected with Splinterlands and their inner workings.
The @token-converter on the second spot with more than 330k HIVE, followed by @nervi.
Note that these are net deposits.
Top Accounts that Withdraw
Here is the chart for the top accounts that withdrew in the period.
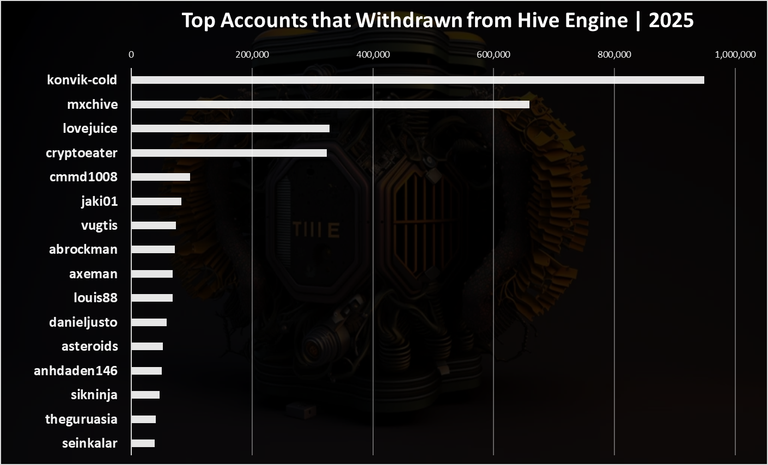
@konvik-cold is on the top here with 950k HIVE, probably related to the farming of the funding rate on Binance, followed by the @mxchive exchange, again most likely for similar reasons. @lovejuice and @cryptoeater with significant amounts as well.
All the best
@dalz
I didn't expect such a contribution. Great to see!
Congrats!
The last withdrawal spike reflect the big hive pump in December
Impressive that the HIVE-BTC pool has a depth of little more than 200k.
Can you do Beeswap next please? 😉
BeeSwap is included here.... what exactly are you interested in?
Fees for the swap.
Yea, I use hive market for all my trading of HIVE for HBD and vice versa. It just works and is simple and easy to use. :) I've never even tried the other two swaps mentioned. 😎🤙
Congratulations @dalz! You have completed the following achievement on the Hive blockchain And have been rewarded with New badge(s)
Your next target is to reach 16000 replies.
You can view your badges on your board and compare yourself to others in the Ranking
If you no longer want to receive notifications, reply to this comment with the word
STOPGreat to see the stats thank you. What am exclusive little crowd we have on Hive.