There has been a push for HBD adoption around the globe. Merchants accepting HBD as payment. This especially in places like Venezuela and Cuba. There is now an app Distriator that enables users to spend HBD, post about it and earn rewards, basically making a cash back on their purchase.
How is this affecting on chain activity. We can take a look at the number of transactions and accounts making transfer. If HBD adoption is increasing this should increase as well.
Let’s take a look.
Here we will be looking at:
- Daily/monthly transactions
- Daily/monthly number of accounts transfering HBD
- Daily/monthly HBD value transfered
- Top accounts by number of transactions and value
The period that we will be looking in is starting from the Hive fork back in March 2020 till now.
Number of HBD Transactions
Here is the chart for the data on HBD transactions made per day.
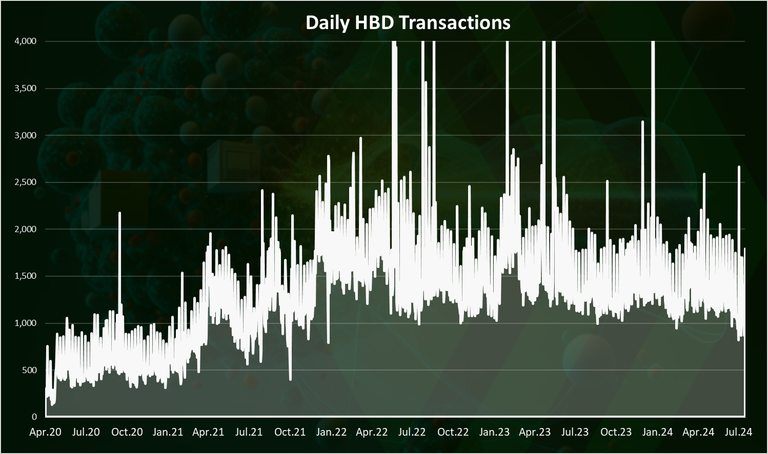
As we can see back in April 2020, this number was low, under 1k HBD daily transactions. It increased since then going up to 3k daily transactions, with occasional spikes up to 10k.
In the last period the number of transactions has been quite steady in the range of 1.k to 2k daily HBD transactions.
When we plot the data on a monthly level we have this:
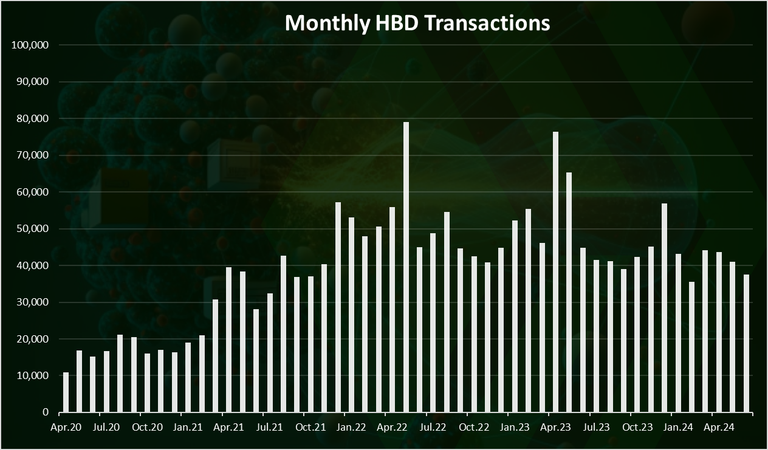
Here we can see an even clearer trend. An uptrend up to 2022, then a period of stagnation.
Overall, no significant uptake in the number of HBD transactions yet!
In the last months there is around 40k HBD transactions per month, with a spike in January 2024 to almost 60k.
Number of Accounts Transferring HBD
How many users are transferring HBD per day? Here is the chart.
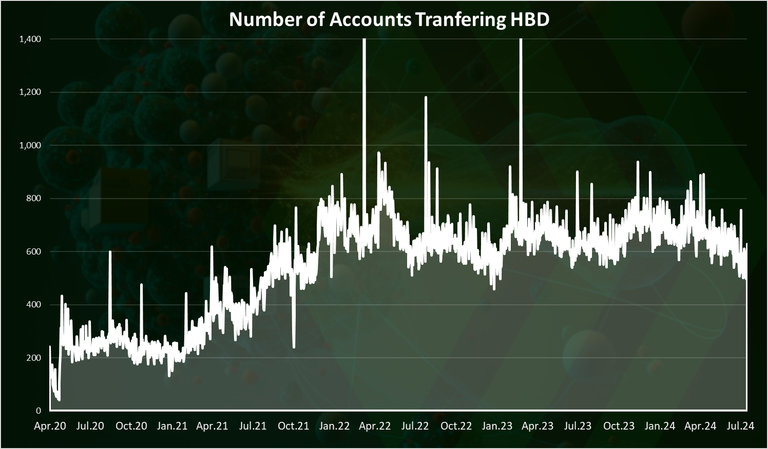
The trend here is similar as for the transactions. At the beginning there is just around 200 DAUs, then the number increased to almost 1k in 2022, and a sort of stagnation since then. We can notice a small downtrend in the last months, at the very end of the chart.
In the last period there are around 600 accounts making HBD transactions per day.
On a monthly level the chart looks like this:
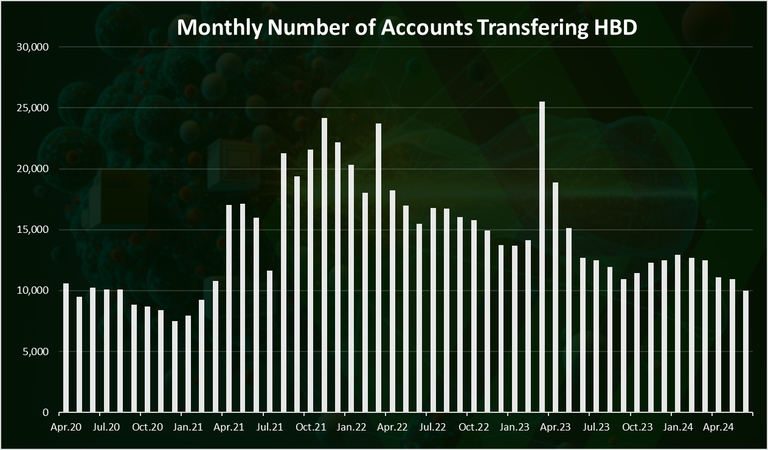
An uptrend towards 2022 and a small downtrend since then.
In the last months the number of HBD MAUs has been just above 10k users per month.
Transferred HBD Value
What about the amount/value in HBD that has been transferred? Here is the chart for the daily amount of HBD transferred.
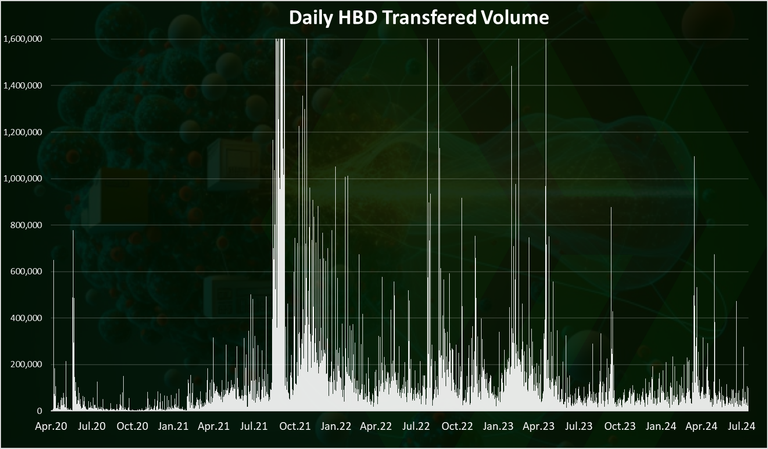
We can clearly see the spike back in August and September of 2021. There was an increase in the HBD value back then and a lot of arbitrages was happening. A few spikes since then to more than a million HBD daily transferred but overall the values are around 100k HBD transferred per day. This is the number for the average daily HBD transferred in the last months as well.
The chart for the monthly HBD transferred looks like this:
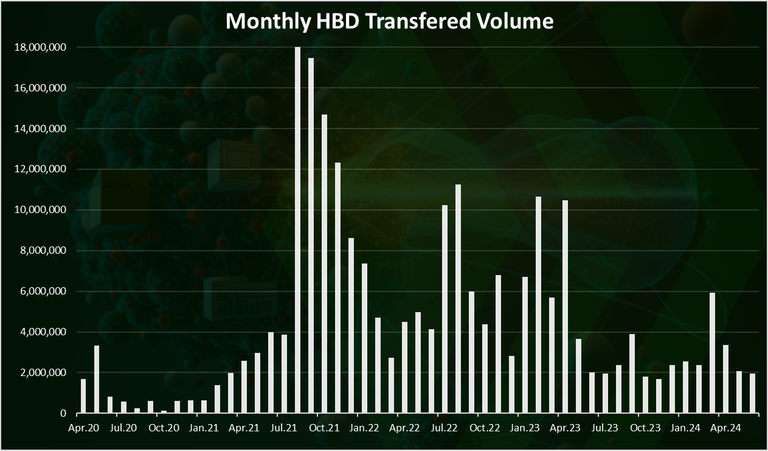
Here again we can see the spikes in August and September 2021. More than 20M HBD was transferred around in August alone and September has been close to 18M.
In the last period there is around 2M HBD volume per month.
Top Accounts
Who is making the most HBD transactions? Here is the chart for the last 30 days.
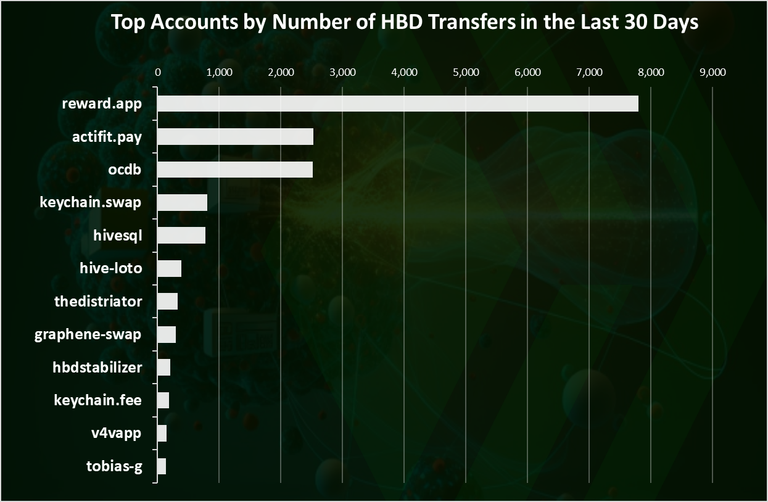
The @reward.app has been making a lot of HBD transactions, almost 8k per month. @actifit.pay is in the second spot, followed by @ocdb. Because of the feeless system on Hive, users can make thousands of transactions in HBD without worrying for gas fees.
The above is in terms of the number of operations. What about in terms of value? Users can make a lot of small transactions with HBD, but some can make a fewer transactions but with bigger HBD amounts.
Here is the chart for the top accounts transferring the biggest volume in HBD in the last 30 days:
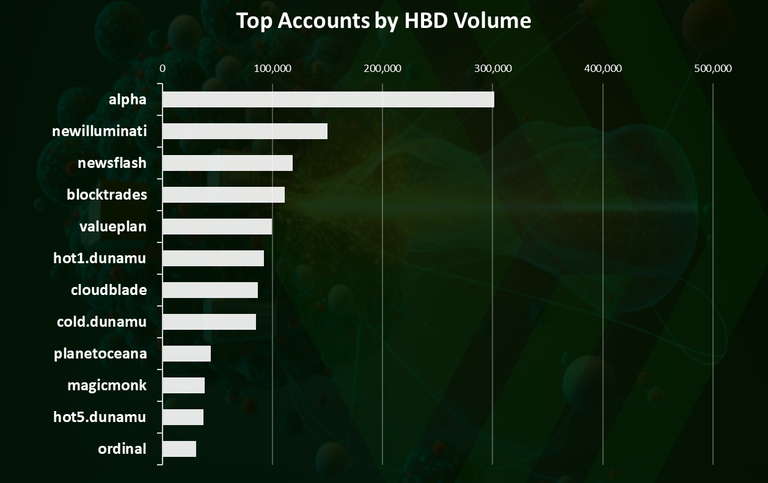
@alpha is on the top here with 300k HBD moved. It’s a transactions for withdrawing out of savings. Next is @newiluminati and @newsflash. All the above are accounts with stake in HBD savings. The
A few accounts that belong to the Upbit exchange are in the top as well.
Summary
The overall trend for HBD is a growth in the numbers of transactions and accounts towards 2022, and then a slow decline and stagnation un the last period. While we can notice that the numbers have been steady, we can still draw a positive conclusion having in mind how hard the bear market hit. Having a project that has retain activity and users is a success for such times.
In 2024 on a monthly level around 10k to 12k accounts are using HBD, making 40k transactions and transferring around 2.5M HBD in value.
All the best
@dalz
That's quite a big conversion from hbd to hive by the alpha account, nice to see and looks like a great timing.
seems like newsflash doing the same
Couldn't agree more 👍👍👍👍👍👍💪💪💪
It doesnt mean its conversion .... its just moving HBD around ....
I meant that I went and checked, looks like 2 of the top 3 accounts did conversions to hive.
https://hivehub.dev/tx/b0bd3c582007b473af0f63914e5ff7b90b2fb832
Yea those are conversions :)
Adoption is everything 😍
Real World Use Cant be beat 🌎
It’s great to see HBD adoption growing despite market challenges. We're hopefully going to have a bright future here
Does the HBD author reward we claim also count as HBD transactions?
No
It’s like those accounts that transfer more HBD are those who pay people to use their services🤔
It seems that the volume is slowly decreasing. We will see how the year ends.
I'm surprised that there aren't more users of HBD. I guess a lot are still not familiar with the savings. Thanks for sharing these data.
Thank you so much for giving us this conversion update and information
A lot of moving here and there, I just think some of this moving might just be to take advantage of the low prices.. thanks for the stats.
Beberapa dari grafik ada peningkatan di tahun 2024 momentum dimana bagi saham hbd meningkat pesat, ada hubungannya dengan plathfrom di blog hive ini mungkin ini tanggapan saya.
Great job